CANADA DATA: Payrolls Rise In July, But Weakening Labor Market Trends Persist
Sep-25 15:34
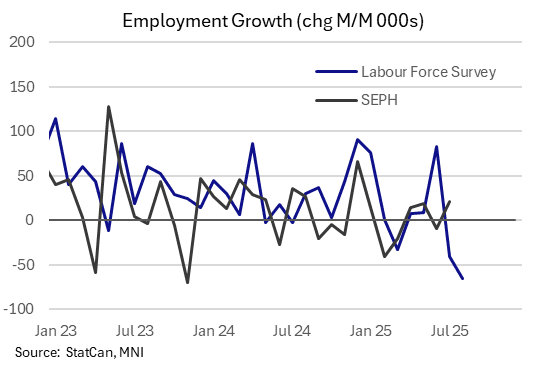
Canadian employee payrolls rose by 21.6k in July (no consensus), the biggest rise since December 2024, per the latest Survey of Employment, Payrolls and Hours (SEPH). This was a pickup from June's 9.1k contraction, which was revised from a 33k drop.
- Payrolls are 15.5k lower than they were 6 months earlier, and have risen just 50.8k over the last 12 months - a sharp slowdown from 12m gains well over 100k in 2024 and 200k in 2023.
- When excluding the less-cyclical public administration and health/social assistance categories, payrolls are basically unchanged over the last two years.
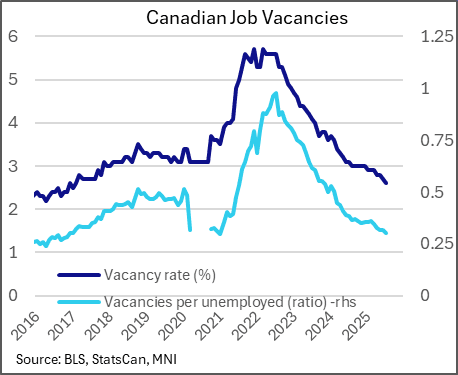
- Against this backdrop, wages have slowed: from over 6% Y/Y at the recent peak in late 2024, fixed-weight hourly wage growth has fallen to 2.7%, weakest since April 2024. And the vacancy rate continues to decline: now just 2.6%, the lowest since February 2017. The ratio of vacancies per unemployed is 0.30, which outside of the start of the pandemic in 2020 is the lowest since January 2017. Overall, vacancies decreased by -4.2% M/M and and -14.5% Y/Y, to 469,900.
- In general the SEPH has portrayed a weaker labour market picture this year than its more timely and closely-watched Labour Force Survey. The last couple of months though, the LFS has shown notable contractions: -65.5k in Aug and -40.8k in Jul, after +83.1k in Jun.
- If nothing else, that illustrates that the two series have been asynchronous over the last few months, though it's possible it is pointing to a contraction in SEPH in August. Both suggest weaker labor market weakness is deepening, offering the BOC more reason to ease policy as output slack increases.
Want to read more?
Find more articles and bullets on these widgets:
Historical bullets
US TSY FUTURES: Midday September'25-December'25 Roll Update: 70%-80% Complete
Aug-26 15:27
Latest Tsy quarterly futures roll volumes from September'25 to December'25 below. Percentage complete currently 70%-80% ahead "First Notice" date this Friday, August 29. Current roll details:
- TUU5/TUZ5 appr 1,266,500 from -9.12 to -8.75, -9.0 last; 80% complete
- FVU5/FVZ5 appr 1,528,800 from -5.5 to -5.0, -5.25 last; 70% complete
- TYU5/TYZ5 appr 926,800 from -1.25 to -0.5, -0.75 last; 71% complete
- UXYU5/UXYZ5 app 550,300 from -0.25 to +0.5, 0.00 last; 72% complete
- USU5/USZ5 appr 312,600 from 12.0 to 12.75, 12.25 last; 79% complete
- WNU5/WNZ5 appr 435,700 from 7.0 to 8.25, 7.75 last; 74% complete
- Reminder, Sep futures don't expire until next month: 10s, 30s and Ultras on September 22, 2s and 5s on September 30.
OPTIONS: Larger FX Option Pipeline
Aug-26 15:16
- EUR/USD: Aug29 $1.1600(E1.3bln), $1.1625(E4.0bln), $1.1700(E1.1bln), $1.1725(E1.1bln)
- USD/JPY: Aug29 Y146.50($1.1bln)
- EUR/GBP: Aug29 Gbp0.8563-80(E2.0bln)
US DATA: Philly Non-Mfg Firms See Faster Price Increases Despite Sensitivity
Aug-26 15:08
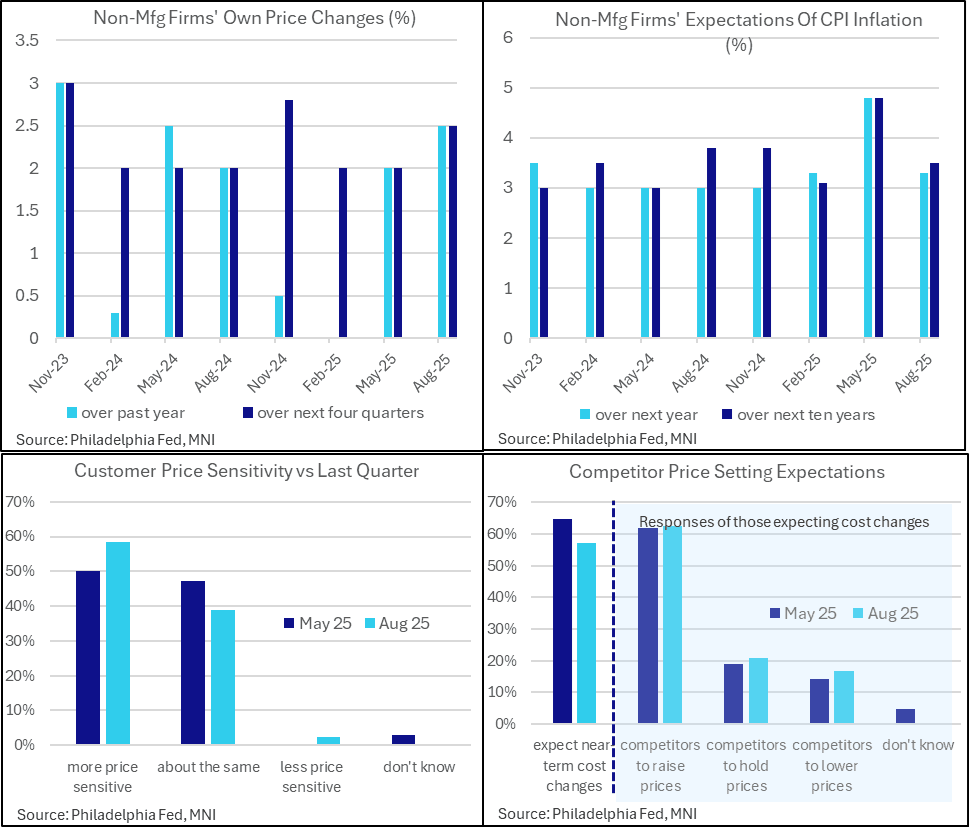
- The Philly Fed non-manufacturing survey special questions on inflation expectations show a somewhat similar split in the activity indexes touched upon earlier with their historically large discrepancy between strong firms’ own activity and weak regional activity in August.
- The median firm reported increasing its own prices by 2.5% over the past year, up from 2.0% in the May question and having essentially paused annual price increases through end 2024/early 2025. It’s the strongest actual increase since the May 2024 survey.
- Own price expectations also firmed from 2.0% to 2.5%, above a typical median of 2% in surveys over the past almost two years but not an unprecedented level.
- Firms’ expectations of consumer inflation meanwhile cooled from a particularly strong May release, with those for the next year reverting to 3.3% from 4.8%. Ten-year ahead expectations also cooled to 3.5% after 4.8%, still above the 3.1% in February prior to reciprocal tariff announcements but within ranges.
- Elsewhere, these non-manufacturing firms reported greater price sensitivity over the quarter (59% reported higher sensitivity vs 50% in May) and fewer expect cost changes over the near-term (57% vs 65%). Of those that do expect cost increases, a similar almost two thirds expect those to be higher, with price changes over a median 3 months vs 2.5 months in the May survey.