EM LATAM CREDIT: Orbia: Potential Asset Sale to Reduce Debt - Positive
(ORBIA; Baa3neg/BBB-neg/BBB)
• The company has reportedly hired Evercore to sell its precision agriculture business and is seeking to raise USD1.3-1.5bn according to Israeli, local Israeli news outlet Calcalist. The company paid USD1.5bn for 80% of the business in 2017, buying the business from the Permira fund, which valued the overall deal at USD1.895bn at the time. Calcalist reports that three funds are considering the purchase so it seems the company may return to private equity ownership if consummated.
• Proceeds of USD1.3bn, would be for a company that generates about USD160mn a year in EBITDA. If Orbia succeeds in selling it, we estimate net leverage for the company could fall to 2.75x from the company’s current net debt/adjusted EBITDA of 3.5x which would be sufficient to keep their investment grade ratings in our view. Note that both neg. outlooks were initiated almost a year ago and 12 months is the typical time frame for when an outlook can become a rating action.
• Orbia 35s were last quoted T+287bp, 13bp wider since June 30th and 58bp tighter since new issue pricing at T+345bp. It’s useful to look at ORBIA 44s as well, last quoted T+291bp. They widened out from T+229bp min-Nov. 2024 to 262bp post the negative outlooks from both rating agencies. The peak spread over the past year was 300bp at the time of the new USD1.1bn of 5s/10s bond issuance April 2025.
• Mexico auto parts maker Nemak (TNEMAK; Ba2/BB+neg/BBB-*-) was last quoted g-spread 263bp so one could argue Orbia bonds are priced for a downgrade to junk and an asset sale to prevent that downgrade could trigger a meaningful market move.
• Fitch said in April 2025 that failure to de-leverage in 2026 would result in a negative ratings action. The rating agency was expecting net leverage of 3x in 2025, dropping to below 2.5x in 2026. Including what the company said were non-recurring items, net debt leverage was reported at 3.98x in 2Q. S&P moved to negative outlook on the rating November 2024, said they were concerned about prolonged net leverage above 3x and they were expecting it could take 12-18 months for that leverage to be reduced.
• Orbia’s precision agriculture business known as Netafim produced 14% of revenues and 13% of EBITDA in 2Q. It is not their largest business but is one of their more stable EBITDA generators. Orbia reports 3Q earnings on October 23rd so we will be looking carefully for any progress on the leverage front.
Want to read more?
Find more articles and bullets on these widgets:
Historical bullets
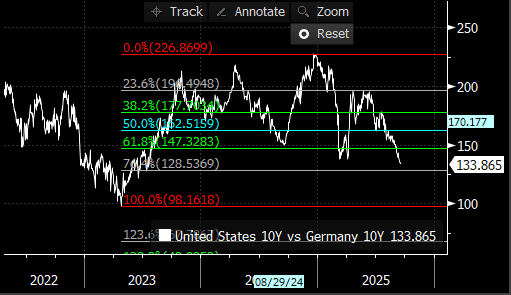
BONDS: US Tnotes/Bund spread falls towards 130.00bps
- Tnotes/Bund spreads tightens by 0.8bp on the day and it continues to clear the 137.7bps level, this was the double bottom of March and April.
- Some Investors will be looking at the 130.00bps next, but better support will be seen at the ~128.5bps area, the 71.4% retracement of the 2023/2024 range.
(Chart source: MNI/Bloomberg Finance LP).
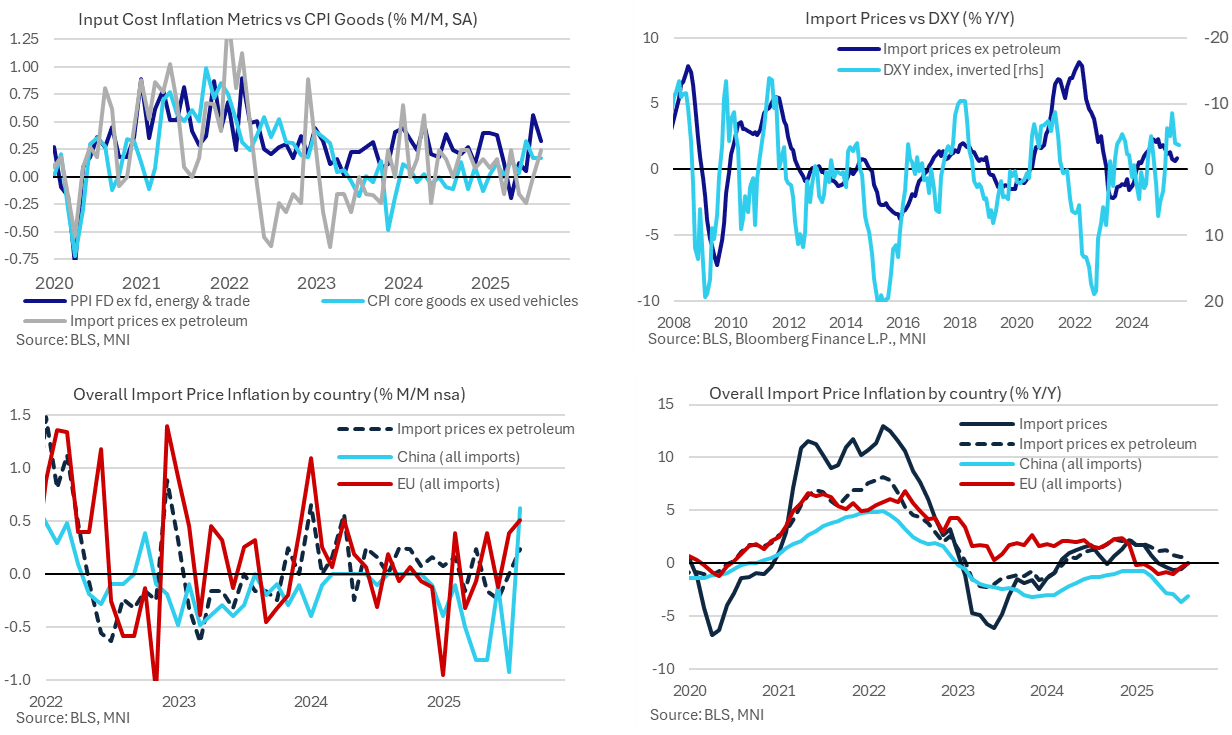
US DATA: Solid Import Price Inflation In August But Softer Revisions Again
Import prices were stronger than expected in August for the third time in the past four months but with the surprise offset by yet another downward revision having been lowered in the past six releases. The latest data suggest that some exporters continued to take some of the tariff hit by lowering their relative prices into July, especially China, but with signs that this stopped in August. Further large revisions do however require the data to be taken with caution.
- Import prices surprisingly increased 0.3% M/M in August (cons -0.2) albeit after a downward revised 0.2% (initial 0.4) in July, with all figures here on a non-seasonally adjusted basis.
- Import prices ex petroleum meanwhile increased 0.2% M/M in August (cons 0.1) for on net weaker than expected considering a downward revised 0.0% M/M in July (initial 0.3)
- The latest profile sees this ex-petroleum series with its strongest monthly print since April after some soft months through May-Jul that hinted at some exporters taking part of the tariff hit. Import prices don’t include tariffs so a lower price could indicate an attempt to preserve post-tariff competitiveness.
- Looking by major trading partner, China still looks to have been the country that has made the largest concession to tariffs (with import prices declining an average -0.6% M/M through Mar-July vs 0.0% in the same period last year) although that has possibly stopped with the latest 0.6% M/M in Aug (vs 0.0% in Aug 2024). Note the scope for revisions however, with the -0.9% M/M now showing for July originally reported as 0.2% M/M.
- Elsewhere, import prices from the EU saw a second solid increase (0.5% M/M after 0.4%), as did Canada (0.5% after 0.6%) and Mexico (0.4% after 0.4%) when switching to manufactured prices for the latter two to avoid swings from oil prices.
- More cleanly capturing trends, overall import price inflation of 0.0% Y/Y was its highest since Apr after two months at -0.6% Y/Y, whilst import prices ex petroleum inflation ticked up three tenths to 0.9% Y/Y although that’s only its strongest since May having recently peaked at 2.3% in 4Q24.
- Import prices by country: China -3.1% Y/Y, EU 0.0% Y/Y, Canada -0.1% Y/Y (manufactured 1.0% Y/Y) and Mexico 0.7% Y/Y (manufactured 2.1% Y/Y).
MNI: US REDBOOK: SEP STORE SALES +6.5% V YR AGO MO
- MNI: US REDBOOK: SEP STORE SALES +6.5% V YR AGO MO
- US REDBOOK: STORE SALES +6.3% WK ENDED SEP 13 V YR AGO WK