FRANCE T-BILL AUCTION PREVIEW: On offer next week
France has announced it will be looking to sell up to a combined E7.8bln of the following BTFs at its auction next Monday, December 15:
- E0.1-0.5bln of the 3-week Jan 7, 2026 BTF
- E3.2-3.6bln of the 13-week Mar 18, 2026 BTF
- E1.4-1.8bln of the new 28-week Jul 1, 2026 BTF
- E1.5-1.9bln of the 50-week Dec 2, 2026 BTF
Want to read more?
Find more articles and bullets on these widgets:
Historical bullets
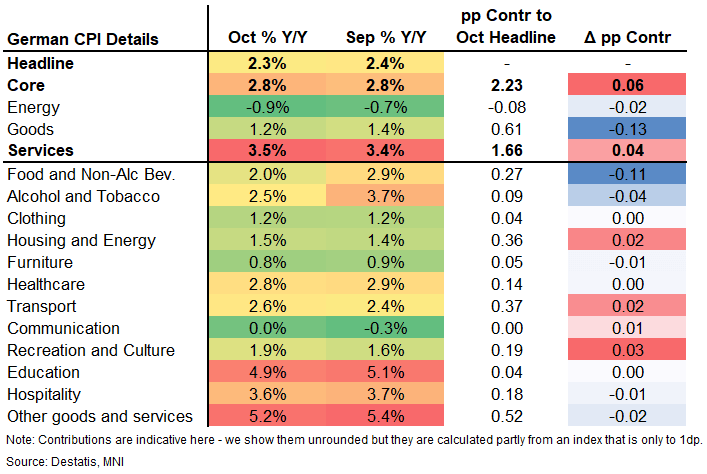
EUROPEAN INFLATION: German Services ex-Airfares CPI Contribution Shrinks [1/2]
German final October HICP was unrevised from the flash readings at 2.3 Y/Y (2.4% in Sep) and 0.3% M/M. The final reading to CPI was also unrevised at 2.3% Y/Y (2.4% in Aug) and 0.3% M/M whilst core CPI remained at 2.8% Y/Y. Details point towards the services upside surprise in the country being airfares-driven, taking away from its relevance for the ECB.
- Services accelerated to 3.5% Y/Y (confirming the flash reading) for its highest rate since April, adding 0.04pp to headline inflation in October. Goods inflation meanwhile more than negated that, with a 0.13pp lower contribution to headline, mostly on the back of both lower food and energy Y/Y.
- As we projected after the state level data ahead of the national-level flash release, airfares were a strongly positive driver, and indeed excluding their contribution the services category would have slowed vs September (airfares added 0.05pp alone, printing 3.1% Y/Y after -4.9% Sep while analysts saw a deceleration in the category).
- This is relevant because the October final inflation figures are likely the final input for the ECB's December projections and President Lagarde in her October meeting press conference again hinted that the persistence of services inflation drivers are important. Today's data confirms the ECB may likely look through the German (and as a function of that, also at least parts of the Eurozone) services upside surprise in October.
- The remainder of the services categories were mostly lower, meanwhile: Healthcare was 2.8% Y/Y vs 2.9% Sep (2.8% MNI tracking), communication 0.0% vs 0.3% Sep (0.0% MNI tracking), hospitality 3.6% vs 3.7% Sep (3.4-3.5% MNI tracking), and education was 4.9% (5.1% Sep, 4.8% MNI tracking). However, recreation and culture accelerated to 1.9% (1.6% Sep; volatile package holidays had a limited effect here; 1.9% MNI tracking).
- Non-core categories were lower across the board, meanwhile: Food (incl. non-alc beverages) was 2.0% Y/Y (2.9% Sep; 2.0-2.1% MNI tracking), while energy moved further into deflationary territory (-0.9% vs -0.7% Sep; no MNI tracking but we did project a fall in the Y/Y rate).
[See the disclaimer below the table on using the changes in contributions with caution]
COMMODITIES: Recent Gains Suggests Corrective Cycle for Gold is Over
The pullback in WTI futures since Oct 24, appears to be a flag formation - a bullish continuation pattern. This suggests that an upward corrective cycle is intact for now. Price has recently traded through the 50-day EMA, at $60.85, signalling scope for a stronger recovery. Note too that resistance at $62.34, the Oct 8 high, has been pierced. A clear move through it would expose key resistance at $65.77, Sep 26 high. The bear trigger is $55.96, the Oct 20 low. The downleg in Gold since Oct 20 appears to have been a correction and has allowed an overbought condition to unwind. Recent gains suggest the correction is over. Price remains above a key support at the 50-day EMA, at $3899.2. Clearance of this EMA would signal scope for a deeper retracement. Initial resistance is at $4161.4, the Oct 22 high. A stronger recovery would refocus attention on $4381.5, the Oct 20 high and bull trigger.
- WTI Crude down $0.58 or -0.95% at $60.47
- Natural Gas down $0 or -0.09% at $4.559
- Gold spot down $2.63 or -0.06% at $4124.23
- Copper up $0.2 or +0.04% at $506.75
- Silver up $0.56 or +1.08% at $51.787
- Platinum up $0.43 or +0.03% at $1587.14
EQUITIES: This Week's Climb for Eurostoxx Reinforces Bullish Conditions
A medium-term bull trend in Eurostoxx 50 futures remains intact and this week’s gains reinforce bullish conditions. The contract has traded through resistance at 5742.00, the Oct 29 high to confirm a resumption of the uptrend. This paves the way for an extension towards 5777.41 next, a Fibonacci projection. On the downside, initial firm support is seen at 5655.99, the 20-day EMA. The trend condition in S&P E-Minis remains bullish and the bear leg since the Oct 30 high appears to have been a correction. The contract has managed to find support below the 50-day EMA, currently at 6722.19, and a key level. Activity on Nov 7 highlights a potential reversal signal - a bullish doji candle. This defines key support at 6655.50, the Oct 7 low. Sights are on 6953.75, Oct 30 high and bull trigger.
- Japan's NIKKEI closed higher by 220.38 pts or +0.43% at 51063.31 and the TOPIX ended 37.75 pts higher or +1.14% at 3359.33.
- Elsewhere, in China the SHANGHAI closed lower by 2.618 pts or -0.07% at 4000.14 and the HANG SENG ended 226.32 pts higher or +0.85% at 26922.73.
- Across Europe, Germany's DAX trades higher by 299.74 pts or +1.24% at 24387.14, FTSE 100 lower by 2.35 pts or -0.02% at 9897.22, CAC 40 up 73.29 pts or +0.9% at 8229.52 and Euro Stoxx 50 up 60.93 pts or +1.06% at 5786.63.
- Dow Jones mini up 77 pts or +0.16% at 48107, S&P 500 mini up 26.25 pts or +0.38% at 6897.75, NASDAQ mini up 173 pts or +0.67% at 25815.5.