MNI US MARKETS ANALYSIS - USD Finds a Floor For Now
Highlights:
- Regional banking concerns undermine risk appetite, pressing US 10y yield below 4.00%
- USD finds a floor as EM FX weakens, markets look more stable into NY hours
- Musalem the final Fed speaker before pre-meeting media blackout formally kicks in
US TSYS: Further Risk-Off Gains Trimmed, A Thin Docket Ahead
- Treasuries are off earlier fresh highs as equity futures have stabilized but on net have extended yesterday’s US regional bank driven gains, which sparked the largest curve-wide DV01 shift seen for several months.
- Regional bank earnings are likely in near-term focus at the start of the session.
- Cash yields are 0.5-3bp lower on the day, with declines led by the front end.
- The bull steepening sees 2s10s at 57bp for back close to yesterday’s 58bp, whilst 5s30s have seen highs of 106.5bp for their highest in nearly a month.
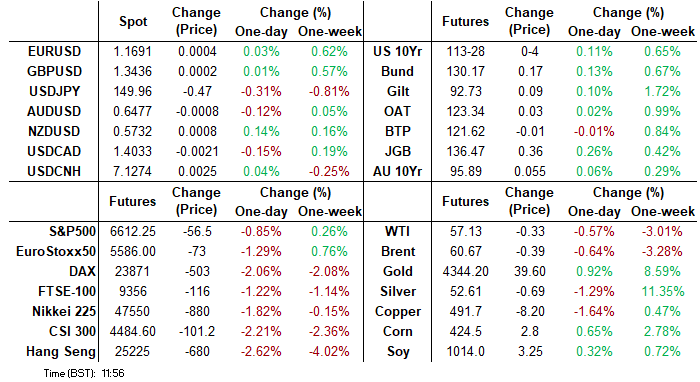
- After seeing solid support at the 4% handle for 10Y yields earlier this week, they now trade comfortably through this at 3.961% (-1.4bp). 10Y yields were last lower in early April on reciprocal tariff deliberations.
- TYZ5 trades at 113-28+ (+04+) on elevated cumulative volumes of 600k, off an overnight high of 114-02.
- It has seen clearance of key resistance at 113-29 (Sep 11 high and bull trigger), confirming a resumption of the medium-term uptrend and opening 114-10 (Apr 7 high continuation). Support is seen at 113-24 (the low with the Asia open).
- Data: We believe the mid-month estimate for Manheim used vehicle prices will be the sole data release today. Housing starts, import prices, IP and TIC flows should all be delayed by the government shutdown.
- Fedspeak: Musalem (1215ET) – see STIR bullet
- Politics: Trump in bilateral lunch with Zelensky (1315ET), Trump departs White House for Florida (1500ET)
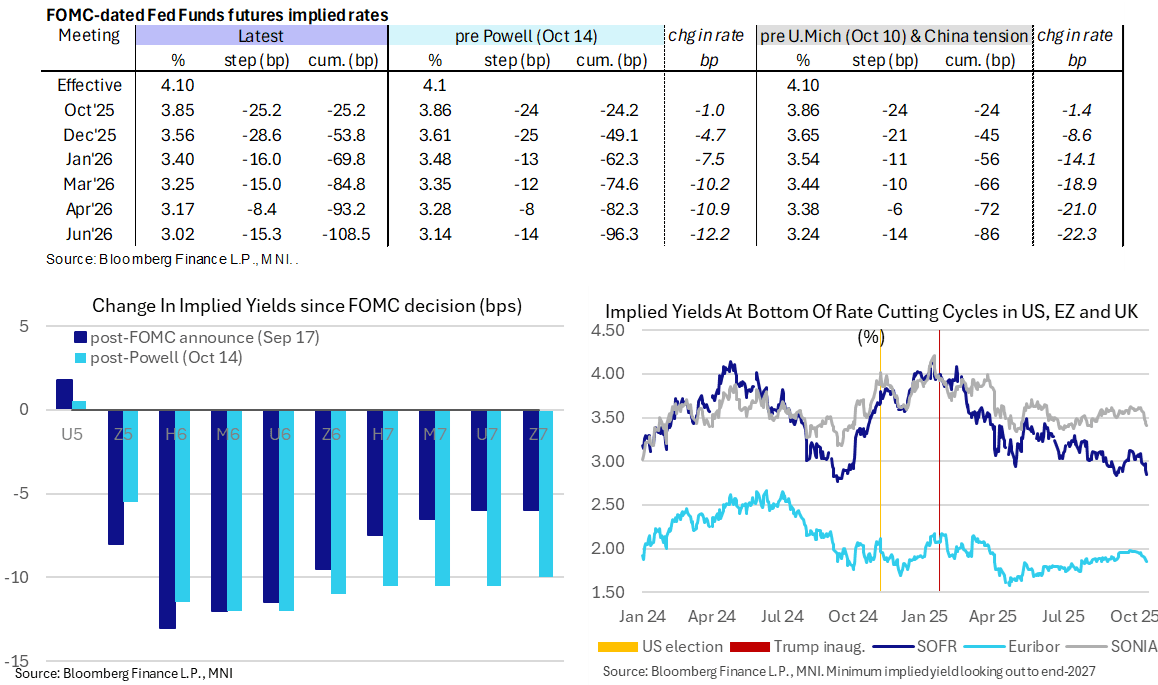
STIR: Fed 50bp Cut In December Considered, Final Day Before FOMC Blackout
- Fed Funds implied rates are off dovish extremes but have fallen further overnight in an extension of yesterday’s US regional bank-driven risk-off.
- The Dec’25 rate is another 1bp lower (seeing ~15% odds of a 50bp cut at that meeting having earlier this week not quite fully priced a second 25bp cut) whilst declines build to -4bp for the Jun’26.
- Cumulative cuts from an assumed 4.10% effective: 25bp Oct, 54bp Dec, 70bp Jan, 85bp Mar, 93bp Apr and 108.5bp Jun.
- SOFR futures see largest gains in the M6-U6 contracts, +4.5 ticks.
- The SOFR implied terminal yield is seen at 2.85% (SFRZ6, -4bp) having dropped 12.5bps since Wednesday’s close. Comparing with prior closes, it’s near recent lows of 2.84% on Sep 8 whilst cycle lows were 2.77% in Sep 2024 ahead of the then start of the FOMC’s easing cycle.
- Today’s sole scheduled Fedspeak comes from St Louis Fed’s Musalem (’25 voter, hawk) in a fireside chat at an IIF conference (no text). He said last week that he sees limited room for rate cuts before we’re too accommodative. He supported the September rate cut as an insurance cut and is open-minded about a potential further rate reduction.
- The media blackout for the Oct 28-29 decision starts tomorrow at 0000ET.
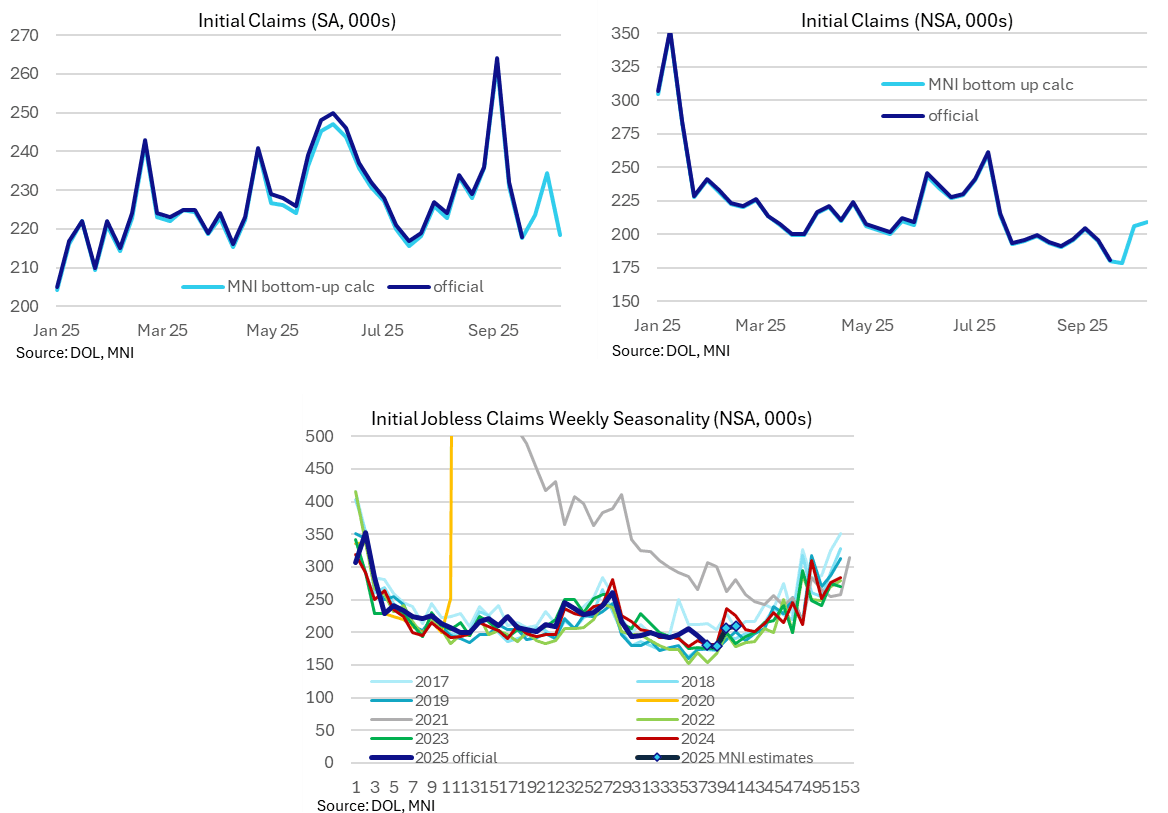
US DATA: Initial Claims Likely At A Healthy Level Last Week (1/2)
MNI estimates for initial jobless claims from state-level data suggest a further decline in the four-week average of seasonally adjusted claims, back towards levels that have been associated with historical labor market tightness.
- MNI estimates initial jobless claims at a seasonally adjusted 218k in the week to Oct 11, down from 234k in the week to Oct 4 (revised slightly from an initial estimate of 233k).
- As should now be familiar under the government shutdown, this uses the state-level data released yesterday afternoon ET with pre-released seasonal factors.
- There is a wider error band to estimates this week. Massachusetts again hasn’t reported this week (for context, 5.1k claims in the previous week). However, whilst Hawaii has reported this time (1.2k in latest data), some larger states haven’t with Arizona (2.8k previous week), Nevada (2.7k previous week) and Tennessee (3.1k previous week) all missing.
- Note that when it comes to using last year’s seasonal pattern for estimates, Tennessee was likely impacted by Hurricanes Helene and Milton around this time of year, suggesting our estimate could err on the higher side.
- Taking 218k as a given, it would see a further encouraging decline in the four-week average to 223.5k. That’s down from a recent peak of 241k in the four-week average of the official series back in early September.
- Much of this prior increase looks to have been down to Texas fraud. Whilst there haven’t been revisions to that previous spike, Texas claims are at least back running at more typical levels (a non-seasonally adjusted 16.4k last week vs 32k in early September).
- As we like to reference for a comparison with past periods of labor market tightness, initial claims averaged 218k through 2019.
- Note also that when looking at the seasonality chart below, the uptick around this time last year should be viewed in light of those aforementioned hurricanes. The latest claims data look in keeping with pre-2024 trends more broadly.
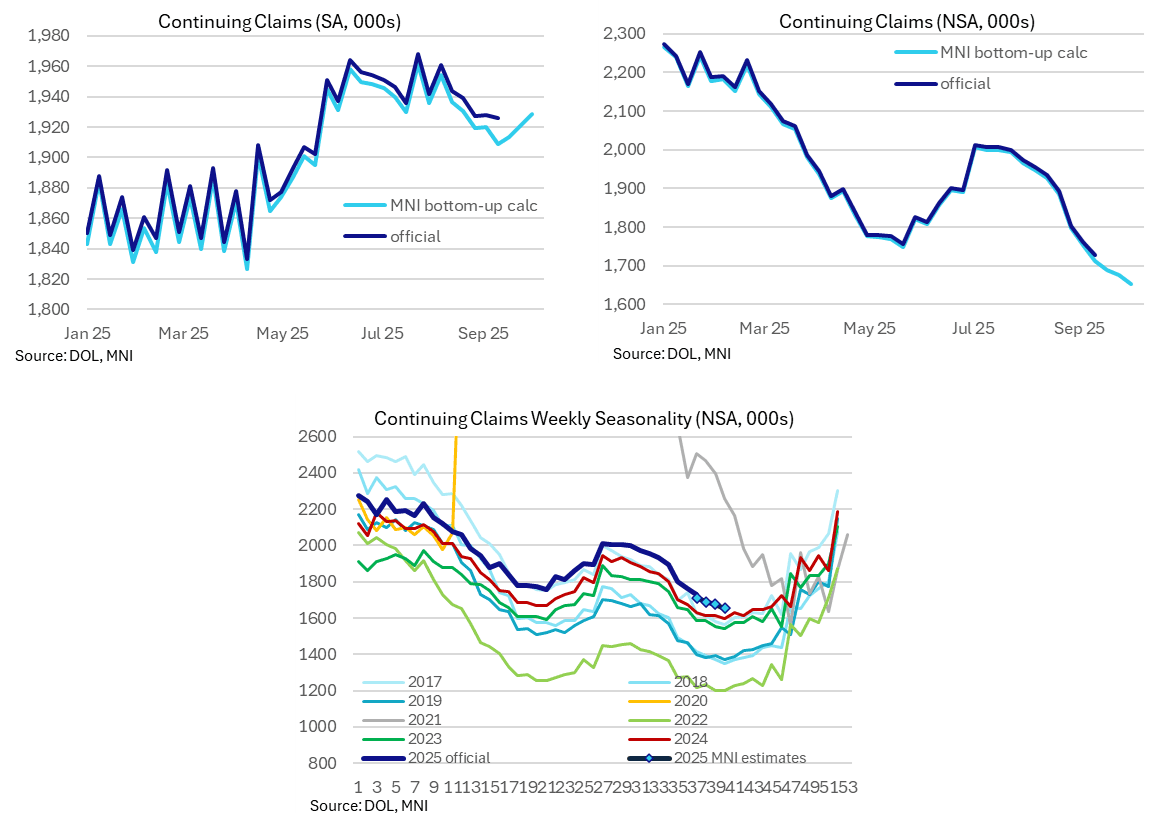
US DATA: Continuing Claims Remain Off June/July Cycle Highs (2/2)
Continuing claims meanwhile remain somewhat elevated by recent year standards but off recent cycle highs. We see the combination as a continuation of a "low fire, low hire" labor market without any notable deterioration being seen.
- MNI estimates continuing claims at a seasonally adjusted 1929k in the week to Oct 4, a small uptick from our estimate of 1920k in the week to Sep 27 (a small downward revision from our initial estimate of 1923k).
- Whilst it’s another small increase from what we calculate to have been 1909k in mid-September, it’s still below recent cycle highs around 1960k’s in June and July.
- That push higher to those levels came with a marked slowdown in hiring at the time, with the continuing claims trend since then implying a stabilization and modest improvement but still chiming with soft hiring conditions.
- Combined with still healthy initial jobless claims figures and these releases broadly point to a continuation of a "low fire, low hire" labor market.
US TSY FUTURES: Net Long Setting Dominated On Thursday
OI data points to net long setting across the curve on Thursday, as Tsys rallied on the latest round of regional bank risk in the U.S.
- That made for over $14mln DV01 equivalent of fresh net longs being added across the curve, the largest curve-wide DV01 shift we have seen for several months.
- Long setting in TY futures (~$4.3mln DV01) provided the largest move in single contract terms.
| 16-Oct-25 | 15-Oct-25 | Daily OI Change | OI DV01 Equivalent Change ($) |
TU | 4,543,572 | 4,527,423 | +16,149 | +627,805 |
FV | 6,769,496 | 6,702,237 | +67,259 | +2,947,888 |
TY | 5,474,175 | 5,409,947 | +64,228 | +4,319,765 |
UXY | 2,479,944 | 2,462,117 | +17,827 | +1,631,193 |
US | 1,898,995 | 1,878,305 | +20,690 | +2,695,872 |
WN | 2,081,766 | 2,071,263 | +10,503 | +2,021,309 |
|
| Total | +196,656 | +14,243,833 |
SOFR: Mix Of Net Short Cover & Long Setting In Futures On Thursday
OI data points to a mix of net short cover and long setting as SOFR futures rallied on the wider risk-off price action seen on Thursday.
- Note that short cover in SFRZ5 provided the largest net positioning swing in single contract terms, outweighing the net long setting seen in the rest of the white pack.
- Net short cover was also seen in the green pack.
- Net long setting was more prominent in both the reds and the blues.
| 16-Oct-25 | 15-Oct-25 | Daily OI Change |
| Daily OI Change In Packs |
SFRU5 | 1,416,820 | 1,409,950 | +6,870 | Whites | -17,097 |
SFRZ5 | 1,481,647 | 1,545,768 | -64,121 | Reds | +39,463 |
SFRH6 | 1,131,622 | 1,109,189 | +22,433 | Greens | -9,740 |
SFRM6 | 1,034,085 | 1,016,364 | +17,721 | Blues | +6,015 |
SFRU6 | 1,009,435 | 1,008,128 | +1,307 |
|
|
SFRZ6 | 1,025,847 | 1,023,613 | +2,234 |
|
|
SFRH7 | 835,383 | 804,286 | +31,097 |
|
|
SFRM7 | 784,041 | 779,216 | +4,825 |
|
|
SFRU7 | 673,869 | 685,647 | -11,778 |
|
|
SFRZ7 | 779,855 | 770,855 | +9,000 |
|
|
SFRH8 | 417,826 | 424,833 | -7,007 |
|
|
SFRM8 | 373,702 | 373,657 | +45 |
|
|
SFRU8 | 308,228 | 306,465 | +1,763 |
|
|
SFRZ8 | 328,657 | 328,382 | +275 |
|
|
SFRH9 | 196,387 | 194,428 | +1,959 |
|
|
SFRM9 | 175,509 | 173,491 | +2,018 |
|
|
CROSS ASSET: Refreshing the MNI Tech Trend Monitor, Adding Gold, Silver, JPY
- We refresh our Global Tech Trend Monitor, adding longer-term techs for Spot Gold, Silver and USDJPY, while refreshing levels for UK Gilt 10y and 30y yields as well as the Europe Banking Stock Index (SX7E).
- See full document here: https://emedia.marketnews.com/marketnewsintl/MNITechTrendMonitorOct25.pdf
FOREX: Heavy APAC Equity Close Weighs on Risk, But Floor Under USD For Now
- After a heavy start to the session, markets have stabilised somewhat, with haven currencies holding their outperformance, while the USD trades mixed and risk proxies (most notably AUD) hold losses into the NY crossover. Heavy equity selling across Asia followed the negative Wall Street close, itself spurred by fresh concerns over regional bank loan portfolios. As such, while focus earlier this week was on big banks and financial institutions, focus has shifted to regional banking reports - and today sees more notable multi-state, regional names reporting: Regions Financial (Alabama), Truist Financial (North Carolina), Fifth Third Bancorp (Ohio) and Huntington Bancshares (Ohio).
- While on more stable footing after the European open, focus is on whether the sell-off extending from regional banks to broader global equities is justified, or whether markets are finding a suitable moment to de-risk after the recent sharp rally.
- USDJPY's new daily low at 149.38 is holding for now - and the USD has recouped a small part of the early losses. The bounce off lows for the USD Index seemed to coincide with a bout of sales in EM currencies; most notably the CNH, ZAR and MXN. In sympathy with JPY gains, CHF stands out: EURCHF's low print of 0.9219 is through the April low, with horizontal support expected layered between 0.9206-22.
- On top of the global risk-off theme, note that Japanese LDP leader Takaichi was effectively confirmed as next PM after Ishin party said it will not continue talks with opposition parties. Looking at today's price action in USDJPY, safe-haven characteristics of the yen outweigh the fiscal and monetary implications of Takaichi's agenda which is now more likely to be implemented. With questions around potential concessions to Ishin party remaining, USDJPY at -0.4% this session pierced below both 150.0 handle and its 20-day EMA, strengthens short-term bearish conditions.
- EM currencies also trade notavly weaker, with ZAR, CNH and MXN the key underperformers. Selling pressure across EM coincided with the particularly heavy Asia-Pac equity close (both CSI 300 and Hong Kong's Hang Seng lower by over 2.0%), which appeared to help put a floor in the USD - despite sharply lower US yields.
FOREX: JPY, CHF Remain Bid, Although USD Recovery Coincides with EM Weakness
Renewed selling pressure via equities through the open is accelerating the risk-off theme, as the e-mini S&P extends losses through 6,600. A particularly soft APAC equity close will also be weighing on sentiment, as the CSI 300 closes down over 2%, and Chinese tech names are hit particularly hard.
- USDJPY's new daily low at 149.38 is holding for now - and the USD has recouped a small part of the early losses. The bounce off lows for the USD Index seemed to coincide with a bout of sales in EM currencies; most notably the CNH, ZAR and MXN.
- In sympathy with JPY gains, CHF stands out: EURCHF's low print of 0.9219 is through the April low, with horizontal support expected layered between 0.9206-22.
- With little data to distract today, market focus will likely be the sustainability of this morning's sell-off, and whether regional US banking write-offs are a true trigger, or an excuse for markets to de-risk after the recent sharp rally and general stability despite growing trade tensions.
OPTIONS: Expiries for Oct17 NY cut 1000ET (Source DTCC)
- EUR/USD: $1.1510-15(E1.9bln), $1.1650-60(E1.2bln), $1.1670-80(E1.4bln), $1.1690-00(E1.0bln)
- USD/JPY: Y150.25-46($2.5bln), Y152.00($784mln)
- AUD/USD: $0.6540(A$529mln)
COMMODITIES: This Week's Move Lower Reinforces Bearish WTI Theme
A bearish theme in WTI futures remains intact and the move down this week reinforces the current bearish theme. Note that moving average studies are in a bear-mode position, highlighting a dominant downtrend. Sights are on $57.50 next, the May 30 low, where a break would open $54.89, the May 5 low. Initial firm resistance is seen at $62.11, the 50-day EMA. Key resistance has been defined at $66.42, the Sep 26 high. A bull cycle in Gold remains intact and this week’s extension reinforces current conditions. The move higher maintains the price sequence of higher highs and higher lows. Sights are on the $4400.00 handle next, and $4404.9, a Fibonacci projection point. Note that the trend is in overbought territory. A move down would be considered corrective and would allow the overbought set-up to unwind. Support to watch lies at $3958.4, 20-day EMA.
- WTI Crude down $0.58 or -1.01% at $56.88
- Natural Gas down $0.03 or -0.89% at $2.913
- Gold spot up $19.42 or +0.45% at $4348.04
- Copper down $10.6 or -2.12% at $489.4
- Silver down $0.4 or -0.74% at $53.8666
- Platinum down $52.5 or -3.06% at $1667.2
EQUITIES: Short-Term Weakness in E-Mini S&P Appears Corrective, For Now
The trend direction in Eurostoxx 50 futures remains up - for now - and the latest pullback appears to have been a correction. The contract remains above key support at 5493.86, the 50-day EMA. A clear break of the 50-day average is required to highlight a stronger reversal. On the upside, the bull trigger is 5689.00, the Oct 2 high. Clearance of this hurdle would confirm a resumption of the uptrend. Short-term weakness in S&P E-Minis appears corrective - for now. Price has recently found support below the 50-day EMA, currently at 6612.26, and the Oct 10 low of 6540.25 has been defined as a key short-term support. Moving average studies remain in a bull-mode position, highlighting a dominant uptrend and positive market sentiment. The bull trigger is 6812.25, the Oct 9 high. A breach of this hurdle would confirm a resumption of the uptrend.
- Japan's NIKKEI closed lower by 695.59 pts or -1.44% at 47582.15 and the TOPIX ended 32.98 pts lower or -1.03% at 3170.44.
- Elsewhere, in China the SHANGHAI closed lower by 76.473 pts or -1.95% at 3839.755 and the HANG SENG ended 641.41 pts lower or -2.48% at 25247.1.
- Across Europe, Germany's DAX trades lower by 520.63 pts or -2.15% at 23751.48, FTSE 100 lower by 154.72 pts or -1.64% at 9281.59, CAC 40 down 68.13 pts or -0.83% at 8122.39 and Euro Stoxx 50 down 86.19 pts or -1.52% at 5566.57.
- Dow Jones mini down 405 pts or -0.88% at 45748, S&P 500 mini down 78.5 pts or -1.18% at 6589.25, NASDAQ mini down 343.25 pts or -1.38% at 24483.5.
| Date | GMT/Local | Impact | Country | Event |
| 17/10/2025 | 1100/1200 | BOE Greene Roundtable at Atlantic Council | ||
| 17/10/2025 | 1230/0830 | * | International Canadian Transaction in Securities | |
| 17/10/2025 | 1230/0830 | ** | WASDE Weekly Import/Export | |
| 17/10/2025 | 1230/0830 | *** | Housing Starts | |
| 17/10/2025 | 1230/0830 | ** | Import/Export Price Index | |
| 17/10/2025 | 1230/0830 | *** | Housing Starts | |
| 17/10/2025 | 1315/0915 | *** | Industrial Production | |
| 17/10/2025 | 1615/1215 | St. Louis Fed's Alberto Musalem | ||
| 17/10/2025 | 1630/1730 | BOE Breeden in Panel at IMF/World Bank Meetings | ||
| 17/10/2025 | 1700/1300 | ** | Baker Hughes Rig Count Overview - Weekly | |
| 17/10/2025 | 1700/1300 | ** | Baker Hughes Rig Count Overview - Weekly | |
| 17/10/2025 | 2000/1600 | ** | TICS | |
| 18/10/2025 | 1130/1330 | ECB Cipollone Speech at Euro50Group Meeting | ||
| 18/10/2025 | 1300/1500 | ECB Lagarde in Economic Outlook Panel at G30 | ||
| 18/10/2025 | 1300/1400 | BOE Bailey at G30 International Banking Seminar |