MNI EUROPEAN MARKETS ANALYSIS: Gold Record High, US Yields Up
- China equities are softer, pulling back after a recent strong run higher. The margin trading balance has surged to a record.
- US Tsy yields have returned from the long weekend and drifted higher. The USD has found some support, although commodities are mostly higher. Gold rose above $3500 (fresh record highs), but gains were pared.
- We heard from BoJ Deputy Governor Himino. The central bank maintains a tightening bias, but there were no hints on timing. The BoJ is watching tariff fallout, particularly on corporate profitability.
- Later the ECB’s Elderson and Machado appear. US August manufacturing PMI/ISM, July construction, euro area August CPI and July French budget data print.
MARKETS
US TSYS: Yields Drift Higher After US Holiday
The TYZ5 range has been 112-09+ to 112-13 during the Asia-Pacific session. It last changed hands at 112-12, down 0-04 from the previous close.
- The US 2-year yield has edged higher trading around 3.63%, up 0.01 from its close.
- The US 10-year yield has edged lower trading around 4.246%, up 0.02 from its close.
- 10-Year Yields continue to find supply toward the 4.20% area, which signals the range might continue to dominate. A break of the recent lows around 4.18% would bring the bottom of the range towards 4.10% back into focus.
- Bloomberg - “World’s Long-Dated Bonds Face a Traditionally Terrible Month. Longer-maturity bonds may be in for a treacherous September, if history is any guide, with government bonds globally with maturities of over 10 years posting a median loss of 2% in September. The trend may worsen due to sticky inflation in Japan, political turmoil in France, and speculation that President Donald Trump may push the Federal Reserve to cut interest rates.”
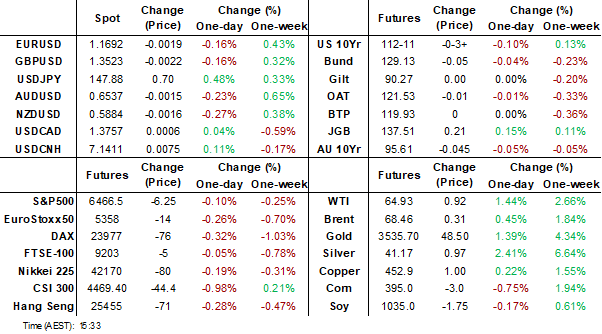
- RenMac on X: “Notable that US 10Y yields are still down year-to-date despite rising rates across G-10, concerns about US fiscal deficits, and the rising risk premium associated with Trump's alleged threatening of the Fed’s policy independence.” See Fig.1 Below.
- Data/Events: S&P Manf. PMI, ISM Manf., Construction Spending
Fig 1: US Bonds Outperforming
Source: MNI - Market News/@RenMacLLC
JGBS: Futures Bounce Post 10yr Auction, But Limited Follow Through
JGB futures have risen in the aftermath of the strong 10yr JGB auction result. We were last 137.48, +.18 versus settlement levels. Post lunchtime break highs were at 137.62, which was just short of earlier Sep highs (137.66), so recent ranges are still holding. The Sep contract opened at 137.32. JGBs are outperforming US Tsy futures, which remain weaker, but are up from session lows.
- The 10yr auction saw a bid to cover ratio of 3.92, versus 3.06 at the prior auction (note the 12-month moving average of the bid to cover ratio is 3.17, per BBG). The tail of the auction was 0.06, versus the 0.14 from the prior outcome.
- Market sentiment was somewhat bearish heading into the auction result, given last week's poor 2yr auction outcome and a slightly heavier US Tsy futures backdrop.
- Still, it may not be a turning point for futures. Earlier headlines crossed: "JAPAN PM ISHIBA MAKING ARRANGEMENT TO INSTRUCT MINISTERS AS EARLY AS THIS WEEK TO COMPILE ECONOMIC MEASURES TO ADDRESS INFLATION, TRUMP TARIFFS, SANKEI NEWSPAPER SAYS - [RTRS]"
- Hence pressure is likely to remain on the government to provide fiscal support.
- Earlier we heard from BoJ Deputy Governor Himino, who struck a balanced tone. He said Tuesday the Bank would raise its policy rate to adjust the degree of monetary accommodation if its baseline scenario for economic activity and prices materialises, though he gave no guidance on timing or pace.
- In the cash JGB yield space, the belly part of the curve is weaker in yield terms, with the 7 and 10yr yield tenors off over 2bps. This puts the 10yr back close to 1.60%. 20-40yr yield tenors are still holding higher in yield terms. The 2/30s JGB curve is 2bps steeper to +234bps.
AUSSIE BONDS: Futures Weaker, But Up From Session Lows, Q2 GDP Tomorrow
Aussie bond futures hold weaker, but are away from session lows. 3yr futures (YM) were last 96.545, off 2bps. Earlier lows were at 96.53, which was just under late August lows. 10yr futures (XM) were last around 95.62, off 3.5pbs. Session lows were at 95.61. The negative bias to US Tsys futures has likely spilled over into Aussie futures to some degree. Sentiment has been helped somewhat in the aftermath of the JGB 10yr auction, which saw solid demand.
- In the ACGB yield space, the bias if for a steeper curve, with yield gains of 2-5bps, led by the back end. The 3yr benchmark was last around 3.44% (+2bps), while the 10yr was close to 4.35% (up 3bps). This benchmark is now back to late July levels.
- On the data front, Q2 net exports contributed 0.1pp to GDP, as expected, while public demand was neutral. Q2 GDP prints on Wednesday and Bloomberg consensus is forecasting a 0.5% q/q increase bringing annual growth to 1.6% from Q1’s 1.3%, in line with the RBA’s August projection. However, almost all estimates were provided before this week’s inventory, net export and public demand data. Inventories were close to consensus and net exports were in line.
- Q2 data show only a 0.1pp contribution to growth from net exports and nothing from public demand as government consumption’s 0.2pp was offset by the 0.2pp drop in public investment. The 0.1% q/q rise in inventories is likely to mean it had a neutral effect on growth.
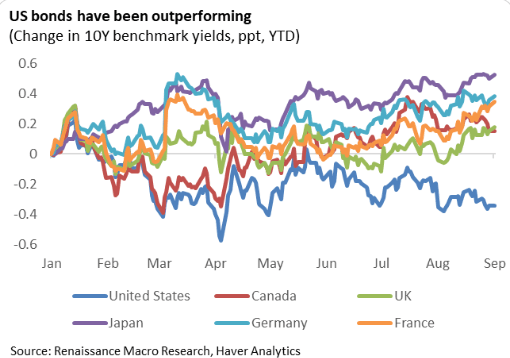
AUSTRALIA DATA: Current Account Deficits Continue, Net Exports Added 0.1pp
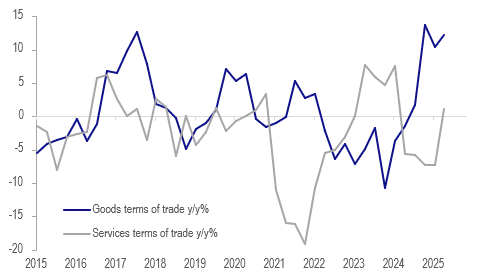
While Q2 recorded its ninth consecutive quarterly current account deficit, it narrowed from Q1 driven by the primary income deficit. Q2 printed at -$13.7bn after $14.1bn with primary income at -$16.8bn down from Q1’s -$18bn but the goods and services surplus was down $1.2bn at $3.1bn, the lowest in 7 years. Net exports contributed 0.1pp to Q2 growth, as expected.
Australia current account A$bn
- Given that the balance of payments data is nominal, the 4.5% q/q fall in merchandise export prices pressured the trade surplus. The goods surplus fell $1bn to $12.7bn in Q2 while services deficit rose $0.2bn to $9.6bn.
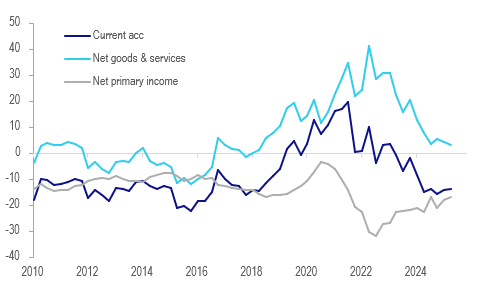
- The terms of trade fell 1.1% q/q & 2.4% y/y due to lower prices for exported coal and iron ore.
- Goods exports fell 0.9% q/q to be up 0.4% y/y driven by a 1.5% q/q decline in non-rural goods. Services exports rose 3.6% q/q & 7.9% y/y, the third consecutive quarterly increase, due to increased visits from New Zealanders.
- Merchandise imports fell 0.2% q/q in Q2 driven by a 1.2% q/q decline in capex and a 6.5% q/q in intermediate goods, as imported petroleum prices fell 11.5% in the quarter. Consumer goods imports rose 3.9% q/q & 3.8% y/y, possibly signalling some recovery in spending. Services imports increased 3.4% q/q to be up 7.8% y/y driven by overseas travel.
Australia terms of trade
Source: MNI - Market News/ABS
AUSTRALIA: Local Banks Q2 GDP Forecasts Below Consensus
Q2 GDP prints on Wednesday and Bloomberg consensus is forecasting a 0.5% q/q increase bringing annual growth to 1.6% from Q1’s 1.3%, in line with the RBA’s August projection. However, almost all estimates were provided before this week’s inventory, net export and public demand data. Inventories were close to consensus and net exports were in line.
- Q2 data show only a 0.1pp contribution to growth from net exports and nothing from public demand as government consumption’s 0.2pp was offset by the 0.2pp drop in public investment. The 0.1% q/q rise in inventories is likely to mean it had a neutral effect on growth.
- Real household consumption rose 0.7% q/q after 0.5%, which may drive a small increase in private consumption growth from Q1’s 0.4% q/q.
- Private capex volumes posted a modest 0.2% q/q in Q2 and so are unlikely to contribute to growth.
- Consensus estimates range from +0.3% q/q to +0.7% q/q and 1.4%-1.9% y/y. ANZ revised down its forecast by 0.2pp to 0.4% q/q following Q2 data. The other local banks are also expecting GDP to be below consensus with NAB forecasting +0.3% q/q & 1.4% y/y and CBA and Westpac both at 0.4% q/q & 1.5% y/y.
NEW ZEALAND: Goods Terms Of Trade Continues Moving Higher
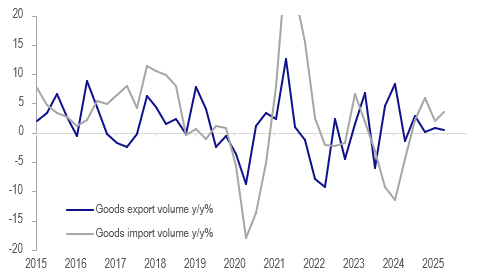
NZ saw the largest improvement in the merchandise terms of trade in Q2 since Q1 2024. It rose 4.1% q/q, the sixth consecutive quarterly increase, to be up 12.2% y/y after 10.3% y/y in Q1. While domestic demand remains soft, this rise in the terms of trade will be providing some welcome support to growth. The services terms of trade fell 0.4% q/q but rose 1.0% y/y after falling 7.3% y/y.
NZ terms of trade y/y%
- A 3.7% q/q fall in imported goods prices drove the terms of trade rise as export prices rose only 0.25% but they are up 11.7% y/y. Dairy export prices rose 2.0% q/q to be up 19.7% y/y after +10.5% & 26.8% in Q1.
- Services saw a 1.8% q/q fall in export prices and -1.4% for imports leaving them up 5% y/y and 4% y/y respectively.
- Goods export volumes fell 3.7% q/q to be up only 0.4% y/y driven by a 7.9% q/q decline in dairy shipments. Import volumes rose 4.2% q/q to be up 3.5% y/y. This signals that Q2 net exports could detract from GDP growth when it is released on September 18.
- Consumption goods import volumes fell 1.3% q/q to be up only 0.5% y/y after -0.1% q/q & +2.3% y/y in Q1. This was the third straight quarterly decline signalling that household spending remains weak.
NZ merchandise trade volumes y/y%
Source: MNI - Market News/LSEG
BONDS: NZGBS: 2/10s Curve To Steepest Level Since April
NZGB yields have seen a steeper bias through Tuesday trade. 10 to 30yr yield tenors are up a little over 4bps, while the 2yr is up less than 1bps. This leaves the 2/10s curve close to +143bps, which is highs back to April of this year. This looks to the playing some catch up with US moves, with the 2/10s Tsy curve just off late August highs.
- The outright 2yr yield remains sub 3.00%, while the 10yr yield is around 4.40%. The 2yr swap rate has risen around 2bps to be near 2.76% in latest dealings.
- US Tsy yields have re-opened, with yields pushing higher across the curve, albeit with gains in the 1-1.5bps region at this stage.
- In terms of data, NZ saw the largest improvement in the merchandise terms of trade in Q2 since Q1 2024. It rose 4.1% q/q, the sixth consecutive quarterly increase, to be up 12.2% y/y after 10.3% y/y in Q1. While domestic demand remains soft, this rise in the terms of trade will be providing some welcome support to growth.
- Via BBG: " The data inflow has improved at the margin over the past fortnight signaling better times ahead, but current economic activity is soft, the Treasury Dept. says in its Fortnightly Economic Update published Tuesday in Wellington."
- Tomorrow, the data calendar sees ANZ commodity prices for August.
FOREX: Asia FX Wrap - USD Finds Some Demand Just Above Support
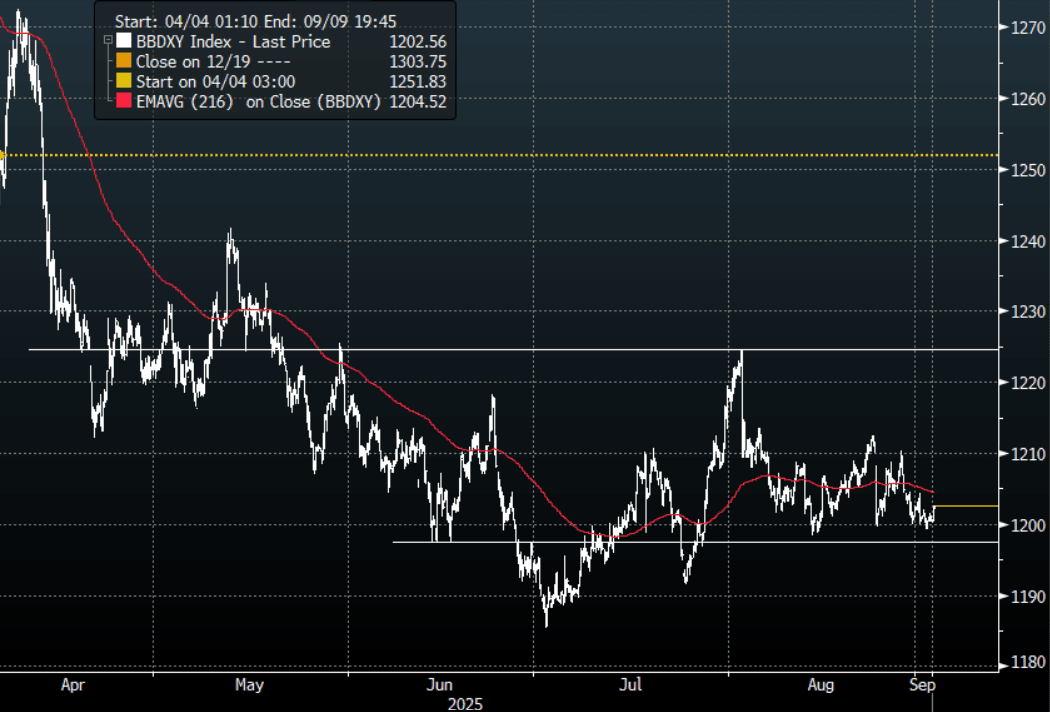
The BBDXY has had a range of 1200.18 - 1202.53 in the Asia-Pac session, it is currently trading around 1202, +0.15%. The USD continues to find demand just above its pivotal support. A sustained break below 1197/1195 is needed to regain the momentum lower and retest the year's lows. The USD is holding just above this support but continues to trade with a heavy tone, not sure we get a clear break though until the market sees what the NFP print is, in order to allocate more risk.
- EUR/USD - Asian range 1.1692 - 1.1718, Asia is currently trading 1.1695. The pair is trading sideways for the moment. First support is back towards 1.1550, a break back above 1.1850 needed to regain upward momentum.
- GBP/USD - Asian range 1.3523 - 1.3549, Asia is currently dealing around 1.3525. The pair is consolidating just above the 1.3500 area. Back in the middle of its recent 1.3350-1.3650 range, the USD’s fate will have a direct impact on which side is tested.
- USD/CNH - Asian range 7.1323-7.1437, the USD/CNY fix printed 7.1089, Asia is currently dealing around 7.1420. Sellers should be around on bounces while price holds below the 7.2200/2500 area and the PBOC manages the fix lower. Above 7.2500 and we could see a test of the USD Shorts.
- Cross asset : SPX -0.10%, Gold $3495, US 10-Year 4.245%, BBDXY 1202, Crude Oil $64.92
- Data/Events : Italy PPI, EZ CPI, France Budget Balance, Spain Unemployment
Fig 1: BBDXY Spot 2H Chart
Source: MNI - Market News/Bloomberg Finance L.P
JPY: Asia Wrap - USD/JPY Demand Sees It Bounce Off 147.00 Again
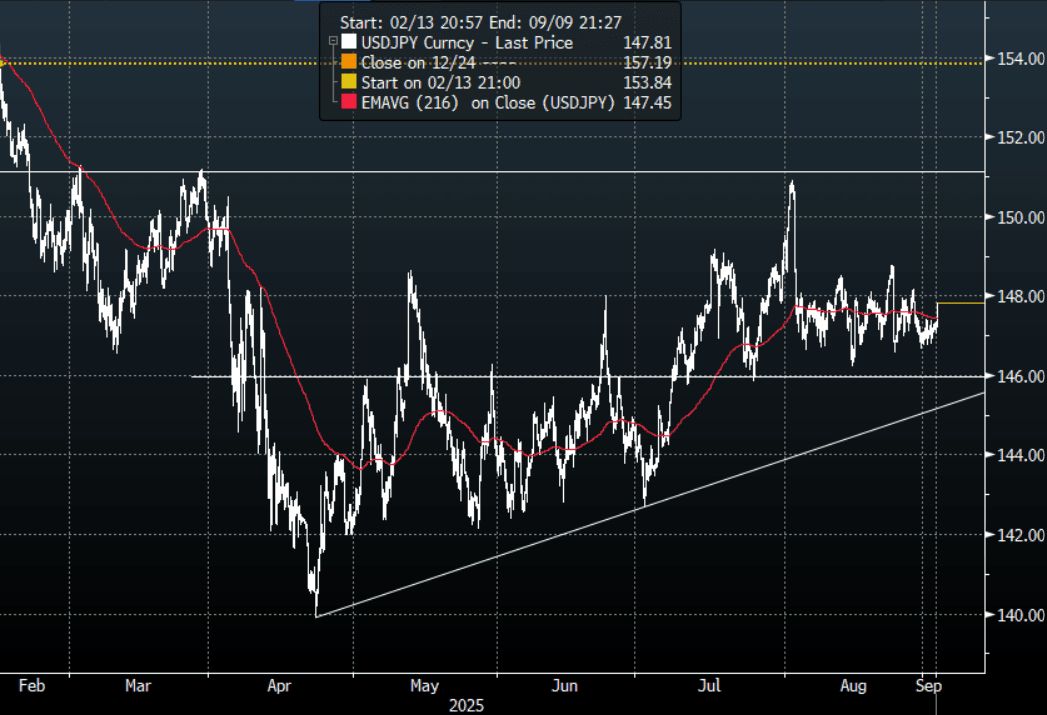
The Asia-Pac USD/JPY range has been 147.05-147.82, Asia is currently trading around 147.80, +0.40%. USD/JPY saw some decent buying into the Japanese Fix, this demand then continued into the afternoon session helping the pair bounce back off its support. The demand towards 146.00 has been pretty solid all of July and August, keeping us for the most part in a 146.00-149.00 range.
- MNI: BOJ's Himino Sees Gradual Hikes; Upside, Downside Risks. Bank of Japan Deputy Governor Ryozo Himino said Tuesday the Bank would raise its policy rate to adjust the degree of monetary accommodation if its baseline scenario for economic activity and prices materialises, though he gave no guidance on timing or pace.
- "BOJ DEPUTY GOV HIMINO: THERE IS BOTH CHANCE TRADE POLICY IMPACT COULD BE SMALLER OR BIGGER THAN EXPECTED, MUST FOCUS ON POSSIBILITY IT COULD BE BIGGER THAN EXPECTED - [RTRS]"
- On the balance sheet: "BOJ DEPUTY GOV HIMINO: BOJ'S PLAN TO REDUCE JGB BUYING SHOULD BE BASED ON PRINCIPLE THAT LONG-TERM RATES ARE TO BE FORMED IN MARKETS, BOJ SHOULD PROVIDE PREDICTABILITY WHILE ALLOWING ENOUGH FLEXIBILITY TO SUPPORT MARKET STABILITY" RTRS
- “JGB Futures Jumping With Relief After Solid 10-year Auction. JGBs are enjoying a leap higher after the bid-to-cover ratio printed at 3.92 for today’s auction, the best since 2023; there’s also a tighter tail than the previous sale. The list of buyers was led by MUFJ-MS, which typically signals long-term buyers participated.” - BBG
- Options : Close significant option expiries for NY cut, based on DTCC data: 148.30($334m).Upcoming Close Strikes : 146.50($1.39b Sept 3), 146.00($2.16b Sept 5) - BBG.
- CFTC data for last week shows leveraged accounts have maintained their recent JPY shorts and will be hoping this support continues to be solid. A sustained break below 145.50/146.00 is needed to to turn the focus back to the year's lows towards 140.00.
Fig 1 : USD/JPY Spot 2H Chart
Source: MNI - Market News/Bloomberg Finance L.P
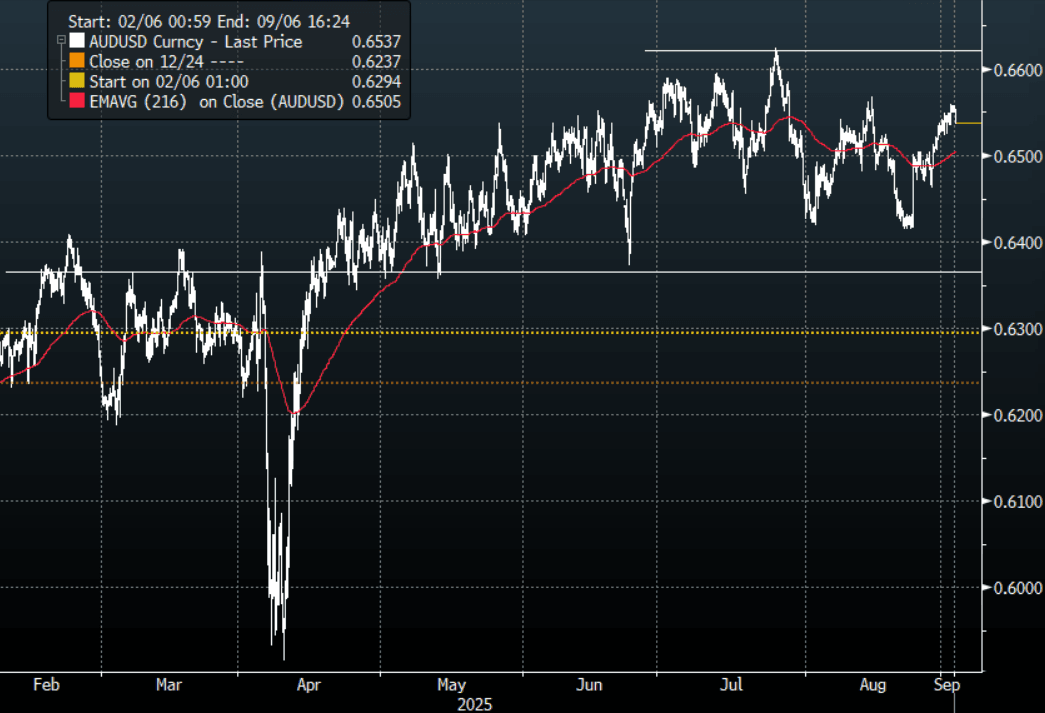
AUD: Asia Wrap - AUD/USD Drifts Lower, Within Range
The AUD/USD has had a range of 0.6537 - 0.6559 in the Asia- Pac session, it is currently trading around 0.6540, -0.20%. The AUD has drifted lower for most of our day. The AUD finds itself firmly back in the middle of its recent multi-month range of 0.6350-0.6650 with little clear long-term direction. The market will be looking towards NFP at the end of the week to hopefully be a catalyst.
- Current Account Deficits Continue, Net Exports Added 0.1pp. While Q2 recorded its ninth consecutive quarterly current account deficit, it narrowed from Q1 driven by the primary income deficit. Q2 printed at -$13.7bn after $14.1bn with primary income at -$16.8bn down from Q1’s -$18bn but the goods and services surplus was down $1.2bn at $3.1bn, the lowest in 7 years. Net exports contributed 0.1pp to Q2 growth, as expected.
- MNI: RBA November Cut Eyed, Lower Productivity To Pull Down R*. The Reserve Bank of Australia is likely to hold at its September meeting before delivering another 25-basis-point cut to the 3.6% cash rate in November, former staffers and leading economists told MNI, with the Bank’s downgraded productivity outlook expected to weigh on neutral rate estimates over the longer term.
- Options : Closest significant option expiries for NY cut, based on DTCC data: 0.6400(AUD770m). Upcoming Close Strikes : 0.6400(AUD1.12b Sept 5), 0.6500(AUD974m Sept 5), 0.6600(AUD1b Sept 5) - BBG
- CFTC Data last week shows Asset managers continue to add to their shorts -78758(Last -72904), the Leveraged community though again reduced their own shorts -6447(Last -7818).
- AUD/JPY - Asia-Pac range 96.37 - 96.65, Asia is trading around 96.60. The pair is probing above the 96.50 area this morning. A sustained move back above 96.50 would turn the trend higher again but until then sellers should be around looking for this move to top out.
Fig 1: AUD/USD spot 2H Chart
Source: MNI - Market News/Bloomberg Finance L.P
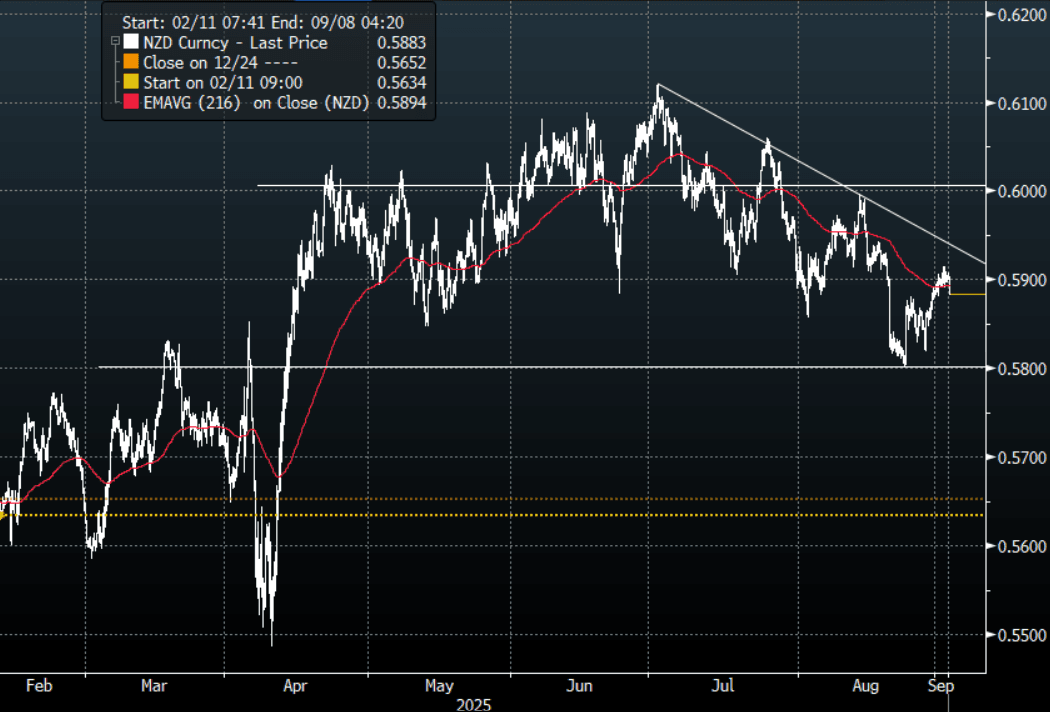
NZD: Asia Wrap - NZD/USD Sellers Return Above 0.5900
The NZD/USD had a range of 0.5883 - 0.5908 in the Asia-Pac session, going into the London open trading around 0.5885, -0.30%. The NZD has topped out above 0.5900 for now as the USD finally sees some demand return. The NZD has bounced off its support toward 0.5800, sellers should continue to be around looking to fade the move back towards the 0.5950/0.6000 area initially. Should the USD break lower and gain momentum this would complicate this trade and then it would be prudent to rotate the NZD shorts into the crosses.
- Goods Terms Of Trade Continues Moving Higher: NZ saw the largest improvement in the merchandise terms of trade in Q2 since Q1 2024. It rose 4.1% q/q, the sixth consecutive quarterly increase, to be up 12.2% y/y after 10.3% y/y in Q1. While domestic demand remains soft, this rise in the terms of trade will be providing some welcome support to growth. The services terms of trade fell 0.4% q/q but rose 1.0% y/y after falling 7.3% y/y.
- "New Zealand Treasury Says Domestic Economic Conditions Are Soft. The data inflow has improved at the margin over the past fortnight signaling better times ahead, but current economic activity is soft, the Treasury Dept. says in its Fortnightly Economic Update published Tuesday in Wellington." - BBG
- Options : Closest significant option expiries for NY cut, based on DTCC data: 0.5700(NZD500m). Upcoming Close Strikes : 0.5700(NZD384m Sept 3) - BBG
- CFTC Data of last week shows Asset Managers added slightly to their new short position in the NZD -4743(Last -3198), the Leveraged community have almost completely exited their short -225(Last -4004).
- AUD/NZD range for the session has been 1.1095 - 1.1112, currently trading 1.1110. Momentum higher looks to have stalled above 1.1100 for now, look for demand to return on a dip back towards the 1.1000 area.
Fig 1: NZD/USD Spot 2H Chart
Source: MNI - Market News/Bloomberg Finance L.P
ASIA STOCKS: China's Bourses Falls as Regional Markets Strong
In what seems like a rarity of late, the major bourses across China all trended lower today following yesterday's strong gains. This comes as data shows Chinese investors are borrowing a record amount of cash to buy local stocks, further fueling a liquidity-driven rally that shows few signs of stalling. The outstanding amount of margin trades in China’s onshore equities market climbed to 2.28 trillion yuan ($320 billion) Monday, surpassing the previous record of 2.27 trillion yuan in 2015. An interesting perspective to note though is despite the latest expansion of margin trades, the size of China’s stock market also has nearly doubled in the past decade. The amount of leveraged purchases as a proportion of total market capitalization was 2.2% as of Monday, slightly above the 10-year average but far below 2015’s peak of 4.6%. (via BBG)
- The Hang Seng is down -0.61% today, having finished yesterday up +2.15%. The CSI 300 has lost ground by -0.91% after closing at new highs yesterday. The Shanghai Comp is down -0.70% and Shenzhen down heavily by -2.3%.
- The NIKKEI has posted modest gains of +0.27%
- The TAIEX in Taiwan is flat today after finishing Monday lower.
- Following the weaker than expected CPI, the KOSPI is up +0.89% as investors begin to extrapolate a rate cut. This following falls of -1.35% yesterday.
- The Jakarta Composite bounced back today as the Finance Minister re-assured markets and is up +1.05%.
- The FTSE Malay KLCI is lower by -0.20% despite better than expected PMIs.
- The NIFTY 50 has had two days of gains; up +0.45% Tuesday morning following +0.81% gains yesterday.
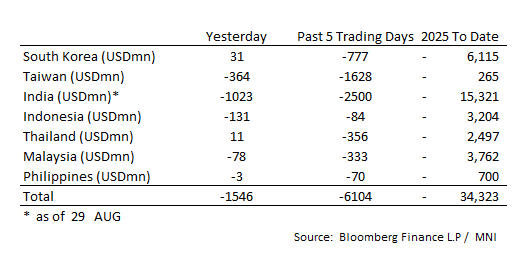
ASIA STOCKS: Very Large Outflows Dominate
One of the largest one day outflow of late across the major markets covered as India suffered a $1bn exit.
- South Korea: Recorded inflows of +$31m yesterday, bringing the 5-day total to -$777m. 2025 to date flows are -$6,115. The 5-day average is -$155m, the 20-day average is -$37m and the 100-day average of +$40m.
- Taiwan: Had outflows of -$364m yesterday, with total outflows of -$1,628m over the past 5 days. YTD flows are negative at -$265. The 5-day average is -$326m, the 20-day average of -$164m and the 100-day average of +$185m.
- India: Had outflows of -$1,023m as of the 29th, with total outflows of -$2,500m over the past 5 days. YTD flows are negative -$15,321m. The 5-day average is -$500m, the 20-day average of -$251m and the 100-day average of -$17m.
- Indonesia: Had outflows of -$131m yesterday, with total outflows of -$84m over the prior five days. YTD flows are negative -$3,204m. The 5-day average is -$17m, the 20-day average +$27m and the 100-day average -$13m.
- Thailand: Recorded inflows of +$11m yesterday, with outflows totaling -$356m over the past 5 days. YTD flows are negative at -$2,497m. The 5-day average is -$71m, the 20-day average of -$33m and the 100-day average of -$14m.
- Malaysia: Recorded outflows as of -$78m yesterday, totaling -$333m over the past 5 days. YTD flows are negative at -$3,762m. The 5-day average is -$67m, the 20-day average of -$40m and the 100-day average of -$12m.
- Philippines: Recorded outflows of -$3m yesterday, with net outflows of -$70m over the past 5 days. YTD flows are negative at -$700m. The 5-day average is -$14m, the 20-day average of -$4m the 100-day average of -$5m.
OIL: Crude Continues Higher As Upcoming OPEC Meeting & US Payrolls In Focus
Oil prices have continued the rally started on Monday. WTI is up 1.4% to $64.90/bbl after reaching $65.10. Brent is 0.4% higher at $68.42/bbl after a peak of $68.58, remaining below resistance at $69.06. The prospect of a near-term easing in sanctions on Russia has faded with the US and EU now looking at extending them after attacks on Ukrainian cities have intensified. The USD index is up 0.1%.
- With the oil market expected to post a substantial surplus in 2026, supply developments are being watched closely.
- OPEC meets on September 7 to decide its October production target. There are still 1.65mbd of previous voluntary output cuts that could be unwound but analysts believe the group will hold production stable.
- Demand also remains in focus with concerns regarding the impact from increased US tariffs but the prospect of Fed easing is calming concerns. Friday’s August US payroll data will be key.
- Later the ECB’s Elderson and Machado appear. US August manufacturing PMI/ISM, July construction, euro area August CPI and July French budget data print.
Gold Back Below $3500 After Reaches New Record High
Gold prices spiked to a new record high of $3508.73/oz earlier in today’s APAC session on increased expectations of a September Fed easing. It is also benefiting from concerns regarding Fed independence. It rose above the bull trigger at $3500.1, 22 April record, but has been unable to hold the break. Bullion is now up 0.6% to $3497.0 despite a stronger US dollar (BBDXY +0.2%) and slightly higher yields.
- UBS believes that gold will continue trending higher driven by softening growth, rate cuts and geopolitical/economic uncertainty, according to Bloomberg.
- After rising 2.5% on Monday, silver is up another 0.3% to $40.82 today, holding just above initial resistance at $40.798. It reached a high of $40.850 after a low of $40.558. Bloomberg reported that in August ETF buying of silver rose for the 7th straight month.
- Silver has also been added to the US list of critical minerals. It is a key component of solar panels. The Silver Institute is expecting 2025 to be the fifth year the metal is in deficit, Bloomberg reported.
- Equities are mixed with the S&P e-mini slightly lower, Hang Seng down 0.6% but KOSPI up 0.8%. Oil prices are stronger again with WTI +1.4% to $64.92/bbl. Copper is little changed.
- Later the ECB’s Elderson and Machado appear. US August manufacturing PMI/ISM, July construction, euro area August CPI and July French budget data print.
ASIA FX: USD/CNH Recovers More Ground, USD/KRW Down Modestly
In North East Asia FX markets, trends are mixed, albeit with aggregate moves fairly modest in the first part of Tuesday trade.
- After breaking lower late last week, USD/CNH has recovered some ground. We were last around 7.1415/20, up a little over 0.10% for the session. Recent lows rest at 7.1159. The USD/CNY fixing edged up, which may have helped drive some short covering in USD/CNH. The onshore equity rally has faltered today. The CSI 300 index is off around 0.90%. There is some focus on the surge in margin related stock investments, although as a share of market cap, we are well below 2015 levels.
- Spot USD/KRW is down a touch, last near 1392. Earlier highs were close to 1395. Local equities have rebounded, with the Kospi up close to 0.90%, but the index remains sub 3200. The August CPI print was below expectations, printing at +1.7%y/y for headline (1.9% was forecast), but the BoK expects it to trend back towards 2% in September.
- Spot USD/TWD has maintained a positive bias, last near 30.65, which is close to late August highs.
- USD/HKD spot is back above the mid point of the peg band, last at 7.8030. Overnight Hibor rates are back lower after yesterday's sharp rise. T/N forward points are back into negative territory at -3.45.
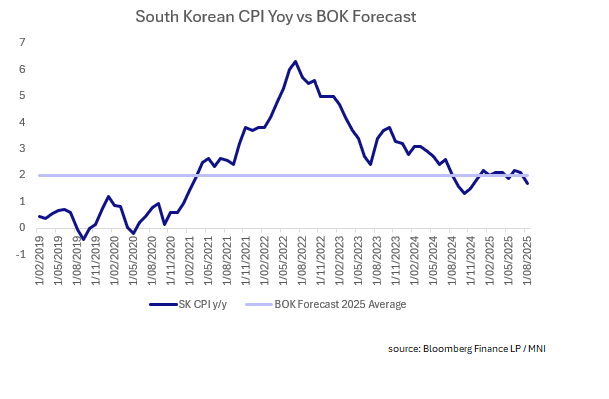
SOUTH KOREA: CPI Below Expectations
- South Korea's CPI for August was below expectations with the month on month figure turning negative.
- Korea's CPI YoY release for August was +1.7%, missing expectations of +1.9%, and down from the July release of +2.1%.
- Food prices rose +4.9% YoY and transport was up just +0.1% YoY.
- The month on month result saw food prices up +2.6% as Core rose +1.3% YoY.
- Market observers expect now that the BOK could cut rates at its meeting in October.
INDONESIA: Country Wrap: BI Steps in to Defend IDR Again
- The Coordinating Minister for Economic Affairs outlined the government’s strategies to achieve the national economic growth target of 5 to 5.2 percent, starting in the second half of 2025. Investment remains the main driver of growth. In the first half of 2025, realized investment reached Rp924 trillion, alongside a 32.5 percent year-on-year (yoy) increase in capital goods imports. “State-owned enterprises (SOEs) capital expenditure and government capital spending, which stood at 17.94 percent in the first half, will support productivity into next year,” he said during a press conference on Indonesia’s capital market stability here on Monday. (source Antara)
- Bank Indonesia (BI) has reaffirmed its commitment to maintaining the stability of the rupiah exchange rate and ensuring sufficient rupiah liquidity in the market, so the currency can move in line with its fundamental value through a well-functioning market mechanism. (source Antara)
- The Jakarta Composite bounced back today as the Finance Minister re-assured markets and is up +1.05%.
- USD/IDR is -0.03% down at 16,424; versus yesterday's close of 16,419 as sentiment declines as political unrest grows. Indonesian Finance Minister Sri Mulyani Indrawati pledged to improve the government's policies after protesters looted her house over the weekend.
- Indonesia's 10-year bond yield has rallied today to be lower by -3bps at 6.37%
UP TODAY (TIMES GMT/LOCAL)
| Date | GMT/Local | Impact | Country | Event |
| 02/09/2025 | 0900/1100 | ** | PPI | |
| 02/09/2025 | 0900/1100 | *** | EZ HICP Flash | |
| 02/09/2025 | 1130/1330 | ECB Elderson and Machado Panel at ECB Legal Conference | ||
| 02/09/2025 | 1345/0945 | *** | S&P Global Manufacturing Index (final) | |
| 02/09/2025 | 1400/1000 | *** | ISM Manufacturing Index | |
| 02/09/2025 | 1400/1000 | * | Construction Spending | |
| 02/09/2025 | 1400/1000 | * | Construction Spending | |
| 02/09/2025 | 1530/1130 | * | US Treasury Auction Result for 26 Week Bill | |
| 02/09/2025 | 1530/1130 | * | US Treasury Auction Result for 13 Week Bill | |
| 02/09/2025 | 1700/1300 | ** | US Treasury Auction Result for 52 Week Bill | |
| 03/09/2025 | 2300/0900 | * | S&P Global Final Australia Services PMI | |
| 03/09/2025 | 2300/0900 | ** | S&P Global Final Australia Composite PMI | |
| 03/09/2025 | 0030/0930 | ** | S&P Global Final Japan Services PMI | |
| 03/09/2025 | 0030/0930 | ** | S&P Global Final Japan Composite PMI | |
| 03/09/2025 | 0130/1130 | *** | Quarterly GDP | |
| 03/09/2025 | 0145/0945 | ** | S&P Global Final China Services PMI | |
| 03/09/2025 | 0145/0945 | ** | S&P Global Final China Composite PMI | |
| 03/09/2025 | 0700/0300 | * | Turkey CPI | |
| 03/09/2025 | 0715/0915 | ** | S&P Global Services PMI (f) | |
| 03/09/2025 | 0715/0915 | ** | S&P Global Composite PMI (final) | |
| 03/09/2025 | 0730/0930 | ECB Lagarde Speaks at ESRB Conference | ||
| 03/09/2025 | 0730/0830 | BOE Mann at Signum's London Westminster Day roundtable | ||
| 03/09/2025 | 0745/0945 | ** | S&P Global Services PMI (f) | |
| 03/09/2025 | 0745/0945 | ** | S&P Global Composite PMI (final) | |
| 03/09/2025 | 0750/0950 | ** | S&P Global Services PMI (f) | |
| 03/09/2025 | 0750/0950 | ** | S&P Global Composite PMI (final) | |
| 03/09/2025 | 0755/0955 | ** | S&P Global Services PMI (f) | |
| 03/09/2025 | 0755/0955 | ** | S&P Global Composite PMI (final) | |
| 03/09/2025 | 0800/1000 | ** | S&P Global Services PMI (f) | |
| 03/09/2025 | 0800/1000 | ** | S&P Global Composite PMI (final) | |
| 03/09/2025 | 0815/0915 | BOE Breeden at Innovation in Money and Payments Conference | ||
| 03/09/2025 | 0830/0930 | ** | S&P Global Services PMI (Final) | |
| 03/09/2025 | 0830/0930 | *** | S&P Global/ CIPS UK Final Composite PMI | |
| 03/09/2025 | 0900/1100 | ** | EZ PPI | |
| 03/09/2025 | 1100/0700 | ** | MBA Weekly Applications Index | |
| 03/09/2025 | - | *** | Domestic-Made Vehicle Sales | |
| 03/09/2025 | 1255/0855 | ** | Redbook Retail Sales Index | |
| 03/09/2025 | 1300/0900 | St. Louis Fed's Alberto Musalem | ||
| 03/09/2025 | 1315/1415 | BOE testify at TSC: Bailey, Greene, Lombardelli, Taylor |