JPY: Asia Wrap - USD/JPY Demand Sees It Bounce Off 147.00 Again
The Asia-Pac USD/JPY range has been 147.05-147.82, Asia is currently trading around 147.80, +0.40%. USD/JPY saw some decent buying into the Japanese Fix, this demand then continued into the afternoon session helping the pair bounce back off its support. The demand towards 146.00 has been pretty solid all of July and August, keeping us for the most part in a 146.00-149.00 range.
- MNI: BOJ's Himino Sees Gradual Hikes; Upside, Downside Risks. Bank of Japan Deputy Governor Ryozo Himino said Tuesday the Bank would raise its policy rate to adjust the degree of monetary accommodation if its baseline scenario for economic activity and prices materialises, though he gave no guidance on timing or pace.
- "BOJ DEPUTY GOV HIMINO: THERE IS BOTH CHANCE TRADE POLICY IMPACT COULD BE SMALLER OR BIGGER THAN EXPECTED, MUST FOCUS ON POSSIBILITY IT COULD BE BIGGER THAN EXPECTED - [RTRS]"
- On the balance sheet: "BOJ DEPUTY GOV HIMINO: BOJ'S PLAN TO REDUCE JGB BUYING SHOULD BE BASED ON PRINCIPLE THAT LONG-TERM RATES ARE TO BE FORMED IN MARKETS, BOJ SHOULD PROVIDE PREDICTABILITY WHILE ALLOWING ENOUGH FLEXIBILITY TO SUPPORT MARKET STABILITY" RTRS
- “JGB Futures Jumping With Relief After Solid 10-year Auction. JGBs are enjoying a leap higher after the bid-to-cover ratio printed at 3.92 for today’s auction, the best since 2023; there’s also a tighter tail than the previous sale. The list of buyers was led by MUFJ-MS, which typically signals long-term buyers participated.” - BBG
- Options : Close significant option expiries for NY cut, based on DTCC data: 148.30($334m).Upcoming Close Strikes : 146.50($1.39b Sept 3), 146.00($2.16b Sept 5) - BBG.
- CFTC data for last week shows leveraged accounts have maintained their recent JPY shorts and will be hoping this support continues to be solid. A sustained break below 145.50/146.00 is needed to to turn the focus back to the year's lows towards 140.00.
Fig 1 : USD/JPY Spot 2H Chart
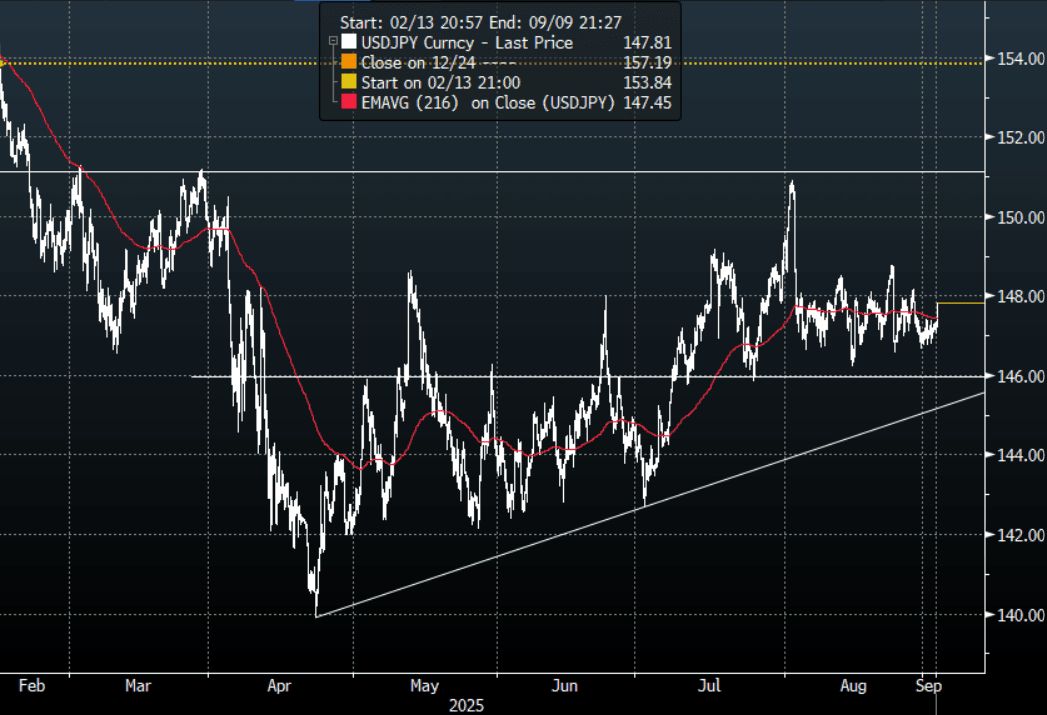
Source: MNI - Market News/Bloomberg Finance L.P
Want to read more?
Find more articles and bullets on these widgets:
Historical bullets
JGB TECHS: (U5) NFP Tips Prices Sharply Higher
- RES 3: 147.74 - High Jan 15 and bull trigger (cont)
- RES 2: 146.53 - High Aug 6
- RES 1: 141.48/142.95 - High May 2 / High Apr 7
- PRICE: 138.63 @ 17:23 GMT Aug 1
- SUP 1: 137.32 - Low Jul 25
- SUP 2: 136.57 - 1.382 proj of the Jan 28 - Feb 20 - Feb 26 bear leg
- SUP 3: 134.89 - 2.000 proj of the Jan 28 - Feb 20 - Feb 26 bear leg
JGBs rallied sharply alongside global bond markets Friday, piercing mid-week resistance in the process. The first important resistance to watch is 141.48, the May 2 high. A break of this level would be viewed as an early bullish signal. A return lower would signal scope for an extension towards 136.57, a Fibonacci projection.
USDCAD TECHS: Slips Sharply on USD Downdraft
- RES 4: 1.4111 Apr 10
- RES 3: 1.4019 38.2% retracement of the Feb 3 - Jun 16 bear leg
- RES 2: 1.3920 High May 21
- RES 1: 1.3879 High Aug 1
- PRICE: 1.3794 @ 17:42 BST Aug 1
- SUP 1: 1.3716/3557 20-day EMA / Low Jul 03
- SUP 2: 1.3540 Low Jun 16 and the bear trigger
- SUP 3: 1.3503 1.618 proj of the Feb 3 - 14 - Mar 4 price swing
- SUP 4: 1.3473 Low Oct 2 2024
A short-term bullish corrective phase in USDCAD remains in play despite sharp weakness Friday. On the recent run higher, price traded through the 50-day EMA at 1.3739 and this has been followed by a break of resistance at 1.3798, the Jun 23 high. Clearance of 1.3798 represents an important short-term bullish development, signalling scope for a stronger recovery. Sights are on 1.3920 next, the May 21 high. On the downside, initial firm support to watch lies at 1.3716, the 20-day EMA.
MACRO ANALYSIS: MNI US Macro Weekly: Poor Payrolls Trumps Patient Powell
- We have published and e-mailed to subscribers the MNI US Macro Weekly offering succinct MNI analysis across the range of macro developments over the past week.
- Please find the full report here.
Executive Summary
- The second half of the week has seen some significant moves in markets from first a patient Fed Chair Powell not giving a nod to a September rate cut before a weak payrolls report with huge downward revisions materially altered recent trends.
- Nonfarm payrolls growth underwhelmed at 73k in July but the major headline was the -258k two-month downward revision, of which -139k came from the private sector and -119k from the public sector. Outside of April 2020, that’s the largest two-month downward revision in at least forty-five years.
- We caution though that whilst jobs growth has soured sharply, it’s doing so along with a significant slowing in labor supply under immigration curbs.
- As such, the unemployment rate may have technically ticked up to a new cycle high of 4.248% (above 4.244% in May) but it continues to roughly plateau in the 4.0-4.25% range seen since last July. The median FOMC forecast from the June SEP had the unemployment rate increasing to an average 4.5% in 4Q25 as part of forecast with two rate cuts in 2025 so further deterioration would be expected.
- A note on the latest initial jobless claims data, which are back at 2019 averages, a period when the unemployment rate averaged 3.7%.
- The weak report prompted an extraordinary response from President Trump, directing his team to fire BLS Commissioner Erika McEntarfer. It’s a broadening out of criticism beyond the Fed’s Powell and its Board.
- Speaking after payrolls, Atlanta Fed’s Bostic (in a non-voting role this year) said he hasn’t changed his view that there should be just one rate cut this year.
- Elsewhere in a major week for data, core PCE inflation exceeded latest Fed tracking in June at 2.8% Y/Y, whilst away from any tariff impact, market-based services inflation printed 3.3% Y/Y. Various inflation metrics showed a continued stabilization at above 2% target rates.
- The Q2 GDP advance release meanwhile beat analyst expectations with 3.0% annualized although it was close to Atlanta Fed GDPNow expectations. PDFP moderated further to 1.2% annualized for its weakest since 4Q22 although could have been worse.
- As a precursor to next week’s ISM Services report, the Manufacturing counterpart was weak across the board in July. Prices paid pulled back from recent highs, new orders chalked up a sixth consecutive month firmly in contraction territory and the employment index fell to its lowest since mid-2020.
- Yields have tumbled after the weak payrolls report. A September cut is mostly priced now vs 50/50 before the release, with a cumulative 59bp by year-end and five cuts in total from current levels.