CANADA DATA: Manufacturing Weakness Dissipating, Potentially Helping GDP
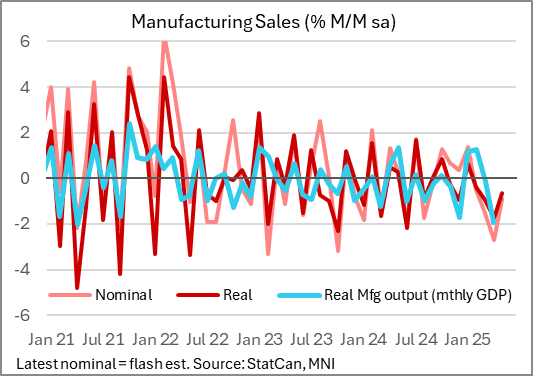
Manufacturing sales were a little less weak than expected in May, contracting for a 4th consecutive month but at -0.9% M/M vs the -1.3% expected. Following -2.7% in April and -1.5% in February, this was the "best" reading since -0.5% in February but still left the level of sales at a 40-year low.
- As with wholesale sales data for the month, the uptick in Manufacturing Sales for May points to less downside pressure manufacturing output in the month, and thus on GDP (due out July 31, after the BOC decision on July 30: advance is for another 0.1% M/M GDP contraction).
- The M/M fall was primarily related to a fall in petroleum and coal product sales (-8.4% to the lowest level since June 2021), without which total sales would have fallen just 0.1%; - and this was attributed in part to shutdowns across refineries across the country. That said, machinery (-2.7%) was also very weak, after -1.0% in April; this was "largely attributable to reduced sales of agricultural, construction and mining machinery".
- Sales in volume terms contracted for the 5th month in 6, at -0.6% M/M (-1.7% prior) to a 43-month low.
- And in potential signs of slack forming, the inventory-to-sales ratio rising to 1.75 from 1.72 prior, a post-May 2020 high - as inventories rose 0.7% M/M. Capacity utilization rose to 78.6% from 76.4%.
- Tariffs continue to be the dominant factor in the slump, though per the report, "According to data collected, the impact of tariffs on Canada's manufacturing sector in May was smaller than in April. In May, nearly half of manufacturers reported being impacted by the tariffs, a decrease of about 10 percentage points from April...Although the precise sales lost due to the tariffs cannot be quantified, data suggest that sales of transportation equipment, machinery and primary metals were most affected in May."

Want to read more?
Find more articles and bullets on these widgets:
Historical bullets
US FISCAL: Available Extraordinary Measures Pick Up Ahead Of Tax Date
Treasury had $144B in "extraordinary measures" available to keep the government financed as of June 11 per a release Friday. That is up from $84B a week earlier and the highest since April 28.
- However, TGA cash continues to fall, to $309B latest (lowest since early April) Combined with a pullback in Treasury cash ($376B), keeping the total resources available to avert an "x-date" in the summer at around $450B .
- There will be another uptick in Treasury cash in the coming days, and it's likely Treasury allowed some of the extraordinary measures to be rebuilt (ie not exercised) in anticipation of more cash coming in.
- This is likely to be the last major uplift before the summer at which point x-date speculation will pick up if Congress hasn't passed a debt limit increase by then.

FED: Two Cuts Priced This Year Headed Into FOMC Week
As we head into the June Fed meeting week, market pricing is reflective of the FOMC’s messaging (that we describe in our preview):
- The next cut is only fully priced by the October FOMC meeting, with September seeing a roughly 80% implied probability of bringing the next 25bp reduction.
- Exactly 50bp of cuts are priced through end-2025, implying two Q4 cuts.
- That’s a shift from just after the May meeting, after which the next cut was fully priced by September, and there were closer to three cuts priced for the rest of the year.
- Overall cuts are seen backloaded this year (after 15bp in September, 29bp of cuts priced in Q4 - Oct/Dec combined), but falls off in Q1 (just 21bp cuts priced, 9bp of cuts priced for January and 12bp for March)

FED: Summary Of Economic Projections: Higher 2025 Inflation, Weaker Growth
The MNI Markets Team’s expectations for the updated Economic Projections are below.
- As of the May meeting, the Federal Reserve staff – whose outlook tends to be broadly shared by the median Committee member – revised their forecasts for growth weaker in 2025 and 2026, “as announced trade policies implied a larger drag on real activity relative to the policies that the staff had assumed in their previous forecast. Trade policies were also expected to lead to slower productivity growth and therefore to reduce potential GDP growth over the next few years. With the drag on demand expected to start earlier and to be larger than the supply response, the output gap was projected to widen significantly over the forecast period. The labor market was expected to weaken substantially, with the unemployment rate forecast moving above the staff's estimate of its natural rate by the end of this year and remaining above the natural rate through 2027."
- On inflation, "The staff's inflation projection was higher than the one prepared for the March meeting. Tariffs were expected to boost inflation markedly this year and to provide a smaller boost in 2026; after that, inflation was projected to decline to 2 percent by 2027."
- Our expectations for these changes fall somewhere in between those projections and the March SEP – a slightly higher unemployment rate, substantially higher inflation in 2025 but to a lesser extent in 2026, and weaker GDP growth this year. Longer-run variables should be unchanged.
MNI Markets Team Expectations For June 2025 Summary Of Economic Projections Medians
