US OUTLOOK/OPINION: Macro Since Last FOMC: Prices - Surprisingly Soft Inflation
- The two CPI reports since the May FOMC meeting surprised lower, the first for April heavily exaggerated by rounding (0.24% M/M vs unrounded consensus of 0.26%) before a large miss for May (0.13% M/M vs 0.27%).
- May’s report started to show some signs of tariff impact across a range of core goods – we estimate the highest median across 56 items since early 2023 – but they were offset by weakness in some heavily weighted items such as new & used cars plus, more surprisingly, apparel. What’s more, core services also surprised softer across both key housing and non-housing components.
- The two PPI reports meanwhile have seen largely benign trends even if trade margins bounced back in May. The PCE-relevant components of PPI were largely neutral on the month in May after a heavy drag in April. That profile has been heavily influenced by portfolio management & investment advice fluctuating on swings in equity markets following US trade policy announcements with near-term strength likely ahead.
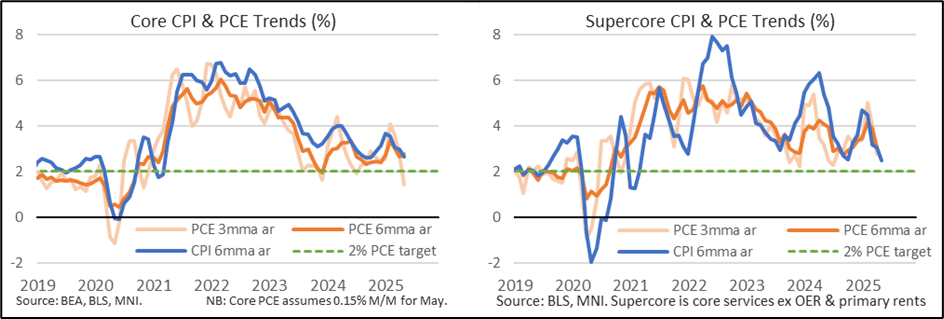
- We’re left with core PCE estimates at circa 0.15% M/M for May (released June 27th), which if realized and without revisions would follow 0.12% in April and 0.09% in March. That’s three particularly subdued months, averaging 1.4% annualized, although it would follow what was a worryingly strong 4.1% in the prior three months.
- The Fed will be vary of this volatility in the data whilst acknowledging a still stubbornly high core PCE Y/Y rate of 2.6% currently expected for May, along with strong increases in market-based services PCE inflation at 3.2% Y/Y back in April.
- Further increases in core PCE are expected as greater tariff-driven inflation shows in the summer months although after May’s surprise weakness, questions could start to be asked if there isn’t a stronger increase in next month’s June data.
Want to read more?
Find more articles and bullets on these widgets:
Historical bullets
RATINGS: Moody's Downgrades US's AAA Rating As Deficits Seen Ballooning
Moody's has downgraded the US's long-term credit rating to Aa1 trom Aaa. The move may not have been fully expected today. But it was the last holdout among they S&P and Fitch to demote the USA from the top rating, and they placed negative outlook on the US last year (now stable). Fiscal deterioration, both past and anticipated as Congress wrangles with the Republican fiscal bill, is cited as the key factor. From the release (link):
- “While we recognize the US’ significant economic and financial strengths, we believe these no longer fully counterbalance the decline in fiscal metrics."
- "This one-notch downgrade on our 21-notch rating scale reflects the increase over more than a decade in government debt and interest payment ratios to levels that are significantly higher than similarly rated sovereigns...We do not believe that material multi-year reductions in mandatory spending and deficits will result from current fiscal proposals under consideration."
- "If the 2017 Tax Cuts and Jobs Act is extended, which is our base case, it will add around $4 trillion to the federal fiscal primary (excluding interest payments) deficit over the next decade. As a result, we expect federal deficits to widen, reaching nearly 9% of GDP by 2035, up from 6.4% in 2024, driven mainly by increased interest payments on debt, rising entitlement spending, and relatively low revenue generation."
- "We anticipate that the federal debt burden will rise to about 134% of GDP by 2035, compared to 98% in 2024."
- "Federal interest payments are likely to absorb around 30% of revenue by 2035, up from about 18% in 2024 and 9% in 2021. The US general government interest burden, which takes into account federal, state and local debt, absorbed 12% of revenue in 2024, compared to 1.6% for Aaa-rated sovereigns."
US FISCAL: "Extraordinary Measures" Continue To Dwindle Amid Debt Impasse
The "extraordinary measures" available to Treasury to stave off a debt default were down to $82B as of May 14, per a Treasury Department release today.
- That compares unfavorably with a high of $335B in January when the debt limit impasse began. Combined with $562B in Treasury cash on hand, though, after April's large tax intakes, that makes for around $644B in available resources before the "x-date" is reached.
- Resources are gradually being eroded since reaching nearly $800B in mid-April.
- Per Tsy Sec Bessent's letter to Congress last week, "after reviewing receipts from the recent April tax filing season, there is a reasonable probability that the federal government's cash and extraordinary measures will be exhausted in August while Congress is scheduled to be in recess. Therefore, I respectfully urge Congress to increase or suspend the debt limit by mid-July, before its scheduled break, to protect the full faith and credit of the United States."

CANADA DATA: Sales Activity Points To Potential Marking Up Of GDP Ests
There was mixed news on the housing and wholesale/manufacturing sales fronts this week, which on net look to slightly upwardly bias Q1 GDP estimates, pending next week's retail sales reading.
Housing starts blew through expectations at 278.6k in April (226.2k expected, 214.2k prior). This came after building permits fell a worse-than-expected 4.1% M/M in March as reported Wednesday.
- Meanwhile, he Canadian Real Estate Association reported existing home says April sales unexpectedly contracted -0.1% M/M (+1.0% expected, -4.8% prior). Sales are now down 9.8% Y/Y, while prices fell 1.2% M/M (3.6% Y/Y on the price index). (Link)
- Overall, confidence appears subdued, which is likely to translate into subdued activity.

On the sales front, March data was soft but positive versus expectations and could add a slight upward drift to Q1 GDP expectations.
- Manufacturing sales were less negative than expected at -1.4% M/M (-1.9% expected/flash estimate, -0.2% prior rev up 0.4pp). The decline was led by primary metals -6.5%, an area hit by U.S. tariffs, and oil -4.2%. Overall Q1 factory sales grew +1.6% vs prior +1.1%.(Link)
- Wholesales ex-petroleum and grains rose 0.2% in March, vs the advance estimate / consensus -0.3%. Sales volumes fell 0.3%. Overall Q1 wholesales rose 2.5%, led by machinery/equipment and autos/parts.
