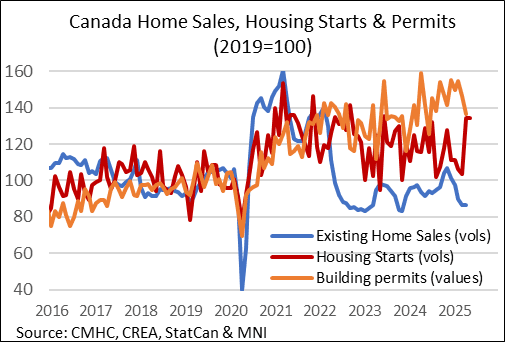
CANADA DATA: Housing Indicators Mixed-To-Weak In May
Housing starts remained steady at 279.5k annualized in May (280.2k prior), remaining near 2-year highs for a second consecutive month and defying expectations for a sharp drop to 247.5k. Alongside this, existing home sales picked up in May by 3.6% (0.1% prior, no consensus), the strongest rise since October 2024. Sales-to-new listings ticked up 0.2pp to 47.0%, a 3-month high, with months of inventory dipping 0.1 to 4.9.
- The CREA expressed cautious optimism: “It’s only one month of data, and one car doesn’t make a parade, but there is a sense that maybe the expected turnaround in housing activity this year was just delayed for a few months by the initial tariff chaos and uncertainty.”
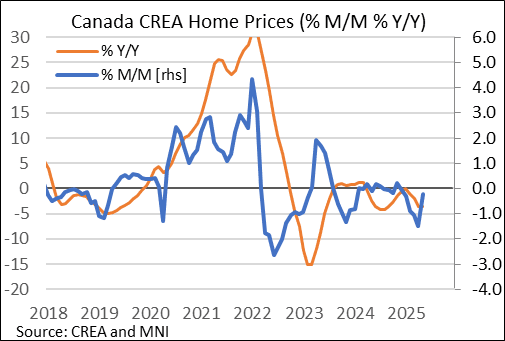
- However sales remain below levels seen throughout most of the last 3 years, not to mention the pandemic boom. And the aggregate HPI composite price benchmark however fell $1.5k to $690.9k, the 5th consecutive decline for a fresh post-May 2021 low (and a 3.7% Y/Y drop, now 17.2% from peak).
- The jump in housing starts is also due to strong gains in urban multifamily housing (34% rise in April, 1% in May), with urban single starts soft. And building permits remain a weak point, dropping 6.6% M/M and 14.0% Y/Y in April, boding poorly for future activity.
- The BOC's latest meeting deliberations noted that while "Housing activity and government spending had declined...they expected some support going forward from new housing policies", presumably including a GST rebate for first time homebuyers.
Want to read more?
Find more articles and bullets on these widgets:
Historical bullets
EURUSD TECHS: Support Remains Intact
- RES 4: 1.1625 1.500 proj of the Feb 28 - Mar 18 - 27 price swing
- RES 3: 1.1608 High Nov 9 2021
- RES 2: 1.1440/1573 High Apr 23 / 21 and the bull trigger
- RES 1: 1.1266/1381 High May 14 / High May 2 - 6
- PRICE: 1.1144 @ 19:09 BST May 16
- SUP 1: 1.1094/65 50-day EMA and a pivot level / Low May 12
- SUP 2: 1.1026 38.2% retracement of the Feb 3 - Apr 21 bull cycle
- SUP 3: 1.0943 Low Apr 10
- SUP 4: 1.0857 50.0% retracement of the Feb 3 - Apr 21 bull cycle
EURUSD continues to trade above last week’s low. Recent weakness appears corrective and key trend signals highlight an uptrend. Note that a key support at the 50-day EMA, at 1.1094, remains intact. A clean break of this average would undermine the uptrend. A key resistance to watch is 1.1381, the May 2 - 6 high. Clearance of this level would signal the end of the correction and highlight a bullish break.
USDCAD TECHS: Bearish Trend Condition
- RES 4: 1.4296 High Apr 7
- RES 3: 1.4111 High Apr 4
- RES 2: 1.4026 50-day EMA
- RES 1: 1.4016 High May 12 / 13
- PRICE: 1.3985 @ 19:49 BST May 16
- SUP 1: 1.3814/3751 Low May 8 / 6 and the bear trigger
- SUP 2: 1.3744 76.4% retracement of Sep 25 ‘24 - Feb 3 bull run
- SUP 3: 1.3696 Low Oct 10 ‘24
- SUP 4: 1.3643 Low Oct 9 ‘24
USDCAD maintains a firmer short-term tone for now. Despite the latest move higher, the trend condition remains bearish and recent strength is considered corrective. A fresh cycle low on May 6 reinforces the bearish theme. A resumption of weakness would open 1.3744, a Fibonacci retracement. Note that moving average studies are in a bear mode position, highlighting a dominant downtrend. Key resistance is seen at 1.4026, the 50-day EMA.
AUDUSD TECHS: Trend Needle Points North
- RES 4: 0.5682 High Nov 12 ‘24
- RES 3: 0.6550 61.8% retracement of the Sep 30 ‘24 - Apr 9 bear leg
- RES 2: 0.6528 High Nov 29 ‘24
- RES 1: 0.6515 High May 7
- PRICE: 0.6404 @ 19:46 BST May 16
- SUP 1: 0.6354 50-day EMA
- SUP 2: 0.6275 Low Apr 14
- SUP 3: 0.6181 Low Apr 11
- SUP 4: 0.6116 Low Apr 10
The trend condition in AUDUSD is unchanged, it remains bullish and recent weakness is considered corrective. The May 13 rally signals the end of the corrective pullback and attention is on key resistance at 0.6515, the May 7 high. Note that moving average studies remain in a bull-mode position, highlighting an uptrend. A resumption of the trend would open 0.6550, a Fibonacci retracement. Key support to monitor is 0.6354, the 50-day EMA.