EURJPY TECHS: Fresh Cycle High
* RES 4: 187.46 Bull channel top drawn from the Feb 28 low * RES 3: 187.20 2.764 proj of the Jul 31 ...
Want to read more?
Find more articles and bullets on these widgets:
Historical bullets
SOFR OPTIONS: Wing Buyers
Recent mixed trade buying up- and downside insurance. Underlying futures near recent lows. Projected rate cut pricing consolidating after this morning's data: current lvls vs. early morning (*): Jan'26 at -3.3bp (-4.4bp), Mar'26 at -11.3bp (-14.8bp), Apr'26 at -17.3bp (-21.9bp), Jun'26 at -30bp (-34.8bp).
- +3,000 SFRZ6 96.25/96.50 2x1 put spds
- +2,500 SFRH6 96.31/96.43 put spds, 6.0
- +8,000 SFRU6 99.00/100.00 call spds, 1.25
- -2,500 SFRH6 96.37 puts, 3.5
- -1,500 SFRH6 96.43 straddles, 15.5
- +1,000 SFRM6/SFRU6 96.75 straddle strip 69.25
EQUITY TECHS: E-MINI S&P: (H6) Bullish Theme
- RES 4: 7021.79 0.618 proj Nov 21 - Dec 11 - 18 price swing
- RES 3: 7014.00 High Oct 30 and the bull trigger
- RES 2: 6988.00 High Dec 11
- RES 1: 6936.25 Intraday high
- PRICE: 6933.75 @ 14:39 GMT Dec 23
- SUP 1: 6835.96/6771.50-day EMA / Low Dec 18
- SUP 2: 6737.71 61.8% retracement of the Nov 21 - Dec 11 rally
- SUP 3: 6678.58 76.4% retracement of the Nov 21 - Dec 11 rally
- SUP 4: 6583.00 Low Nov 21
The recent pullback in S&P E-Minis appears to have been a correction. A key short-term support has been defined at 6771.50, the Dec 18 low. A break of this level would signal scope for a deeper retracement of the recent bull phase between Nov 21 - Dec 11. This would open 6737.71, a Fibonacci retracement. For bulls a continuation higher would refocus attention on key resistance at 7014.00, the Oct 30 high.
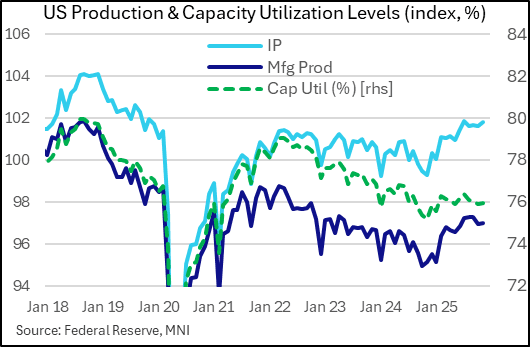
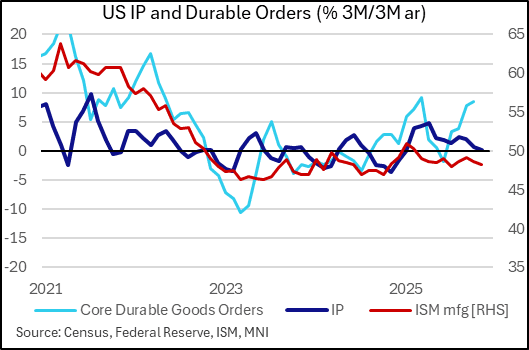
US DATA: Flat Industrial Production Momentum, Though Prospects Look Better
Industrial production barely grew on net over the October/November period vs September, with a 0.12% 2-month rise implied by the Oct (-0.06% M/M) and Nov (+0.17%) readings. The broader picture is that while core durable goods orders suggest a potential pickup ahead, especially given the bounceback in November, actual industrial production momentum has shown signs of slowing through the first 2 months of Q4, with manufacturing showing notable weakness.
- The 3M/3M annualized growth rate has fallen from 2.1% in September to 0.2% in November, which marks the weakest since January; much attention has been paid to the Y/Y rate improving to a 43-month best 2.5% (1.9% in September) though this is flattered by very weak figures at end-2024.
- Oftentimes it's the volatile utilities category that drags on the headline index, but in this case while utilities did soften in November (-0.5% M/M) this was after +2.6% in October, bringing the 3M/3M ann. growth rate up to an 8-month best 3.2%.
- Instead it was the manufacturing sector that disappointed, with a 0.37% M/M contraction in October sandwiched by flat growth in August/September and November. The 3M/3M annualized growth rate fell into contraction for the first time in 10 months, at -0.2%.
- If anything, blushes were spared by a strong performance in mining (+1.7% M/M in Nov, after -0.7/-0.8% contractions in the prior 2 months).
- Nondurable consumer goods, energy industrial and business equipment investment production are at/near pre-pandemic levels, but durable consumer goods production remains weak. Indeed among the major market groups, business equipment has been the star of 2025, up 11.2% Y/Y with all other categories below the 2.5% total index rise.
- Capacity utilization was steady over the 2-month period (76.0%).
- The monthly reports were, unusually, combined and delayed due to the government shutdown, as the Fed was unable to get some of the underlying data necessary to produce the production indices. But overall, unlike the October durable goods report which looked quite solid and suggest a pickup lies ahead, this report offered a more cautionary portrayal.