USDCAD TECHS: Fresh Cycle High
- RES 4: 1.4393 2.0% 10-dma envelope
- RES 3: 1.4327 2.382 proj of the Oct 17 - Nov 1 - 6 price swing
- RES 2: 1.4296 2.236 proj of the Oct 17 - Nov 1 - 6 price swing
- RES 1: 1.4246 2.00 proj of the Oct 17 - Nov 1 - 6 price swing
- PRICE: 1.4236 @ 16:38 GMT Dec 13
- SUP 1: 1.4069/3944 20- and 50-day EMA values
- SUP 2: 1.3928 Low Nov 25 and a key support
- SUP 3: 1.3822 Low Nov 6
- SUP 4: 1.3747 Low Oct 17
The trend direction in USDCAD remains up and this week’s gains to a fresh cycle high, reinforces the current bullish theme. The pair has cleared 1.4178, the Nov 26 high, to confirm resumption of the uptrend and maintain the price sequence of higher highs and higher lows. Sights are on 1.4246 next, a Fibonacci projection. Key short-term support has been defined at 1.3928, the Nov 25 low. Initial support to watch lies at 1.4069, the 20-day EMA.
Want to read more?
Find more articles and bullets on these widgets:
Historical bullets
USDCAD TECHS: Breaches Resistance
- RES 4: 1.4195 2.0% 10-dma envelope
- RES 3: 1.4034 1.00 proj of the Oct 17 - Nov 1 - 6 price swing
- RES 2: 1.4000 Round number resistance
- RES 1: 1.3999 High Nov 13
- PRICE: 1.3977 @ 16:46 GMT Nov 13
- SUP 1: 1.3851/22 20-day EMA and a key S/T support / Low Nov 6
- SUP 2: 1.3757 50-day EMA
- SUP 3: 1.3611 Low Oct 8
- SUP 4: 1.3567 Low Oct 7
USDCAD traded higher again Wednesday as the pair extends the recovery from the Nov 6 low. The pair has topped the most recent trend peak of 1.3959, the Nov 1 / 6 high. This confirms a resumption of the uptrend and has also resulted in a print above 1.3977, the Oct 13 2022 high and a key medium-term resistance. Sights are on the 1.4000 handle. Initial firm support to watch lies at 1.3860, the 20-day EMA.
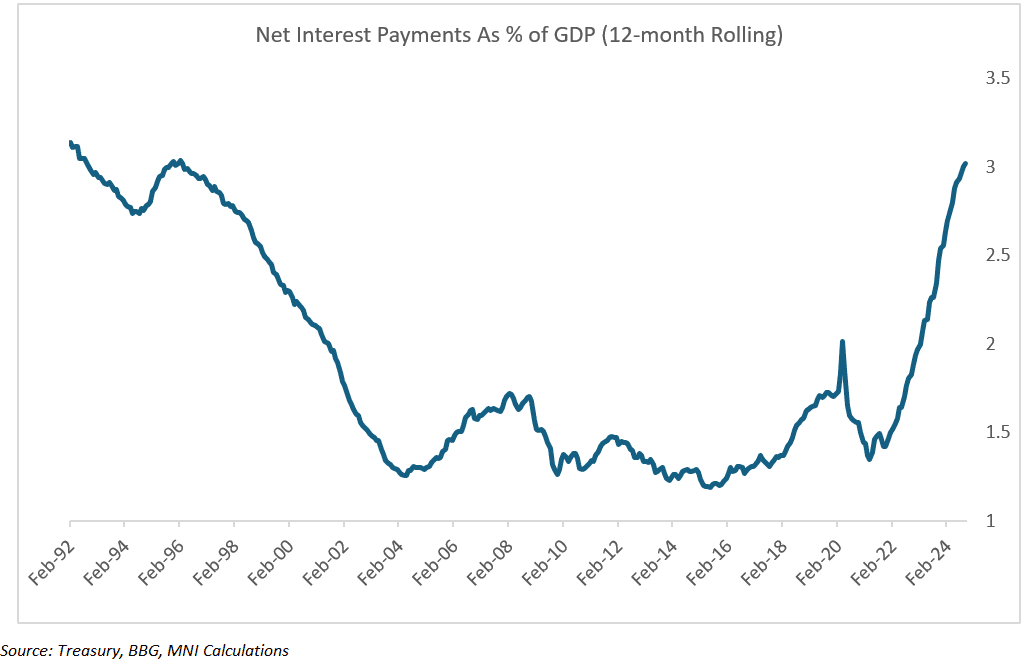
US FISCAL: Deficit Higher Than Expected To Start FY2025 As Debt Servicing Stings
With a $257.5B budget deficit in October (up from $66.6B a year earlier), the new 2025 federal fiscal year (Oct-Sep) has gotten off to a weaker start than expected (a shortfall of $232.5B median / $212.2B average had been expected).
- The 12-month rolling balance is -$2.024T, putting it in the high 6% of GDP area (FY 2024 was 6.4% for the year), with 12M cumulative expenditure at $6.87T vs revenue of $4.84T.
- While the overall nominal 12M expenditure figure is still below Covid highs, the net interest bill continues to soar: the $886B spent on debt service over the past 12 months is a new all-time high. As a percentage of GDP, it's estimated at around 3% per MNI calculations - another fresh post-1990s high, and double the post-GFC norm.
- The incoming Trump administration aims to cut the fiscal deficit via various measures, including finding efficiencies and closing government departments - even so, with net interest payments mounting (the CBO in June saw such payments rising above 3.5% of GDP by the end of the decade), and mandatory outlays set to rise (CBO: 13.9% of GDP to 14.6% by 2030), the challenges are formidable.
- And even the CBO's projections assumed 10Y Treasury yields would fall from a peak of 4.5% in FY2024, to 3.6% toward the end of the decade.
AUDUSD TECHS: Bear Trigger Remains Exposed
- RES 4: 0.6762 High Oct 9
- RES 3: 0.6727 50.0% retracement of the Sep 30 - Nov 6 bear leg
- RES 2: 0.6671/88 50-day EMA / High Nov 7
- RES 1: 0.6622 20-day EMA
- PRICE: 0.6485 @ 16:43 GMT Nov 13
- SUP 1: 0.6480 Low Nov 13 and the bear trigger
- SUP 2: 0.6508 Low Aug 8
- SUP 3: 0.6490 76.4% retracement of the Aug 5 - Sep 30 bull leg
- SUP 4: 0.6472 Low Aug 6
A bear cycle in AUDUSD remains intact and recent gains appear to have been a correction. The latest sell-off signals the end of the Nov 6 - 7 corrective bounce and attention is on key support and the bear trigger at 0.6513, the Nov 6 low. A breach of this support would confirm a resumption of the downtrend and open 0.6490, a Fibonacci retracement point. Firm resistance is at 0.6671, the 50-day EMA (pierced).