USDCAD TECHS: Approaching The Bull Trigger
- RES 4: 1.4019 38.2% retracement of the Feb 3 - Jun 16 bear leg
- RES 3: 1.3968 High May 20
- RES 2: 1.3925 High Aug 22 and the bull trigger
- RES 1: 1.3907 High Sep 24
- PRICE: 1.3898 @ 08:01 BST Sep 25
- SUP 1: 1.3794/3727 50-day EMA / Low Aug 29 and a bear trigger
- SUP 2: 1.3709 61.8% retracement of the Jul 23 - Aug 22 bull cycle
- SUP 3: 1.3658 76.4% retracement of the Jul 23 - Aug 22 bull cycle
- SUP 4: 1.3637 Low Jul 25
Wednesday’s rally in USDCAD undermines a recent bearish theme as the pair extends the recovery from the Sep 17 low. The pair has pierced resistance at 1.3890, the Sep 11 high. This exposes key resistance at 1.3925, the Aug 22 high and the bull trigger. Clearance of this hurdle would highlight an important short-term bullish break. Initial support to watch lies at 1.3794, the 50-day EMA.
Want to read more?
Find more articles and bullets on these widgets:
Historical bullets
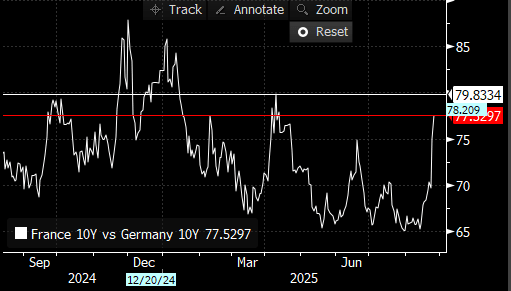
BUNDS: OAT/Bund spread widest since April
- Continued widening in the OAT/Bund spread, 2.6bps wider, and at its highest level since April, following the French PM calling for a confidence vote on the 8th September.
- Next immediate resistance comes at the Psychological 80.00bps, which would be its widest since January.
The April high stands at 79.83bps.
(Chart source: MNI/Bloomberg Finance LP).
USDCAD TECHS: Bull Cycle Still In Play
- RES 4: 1.4111 High Apr 10
- RES 3: 1.4019 38.2% retracement of the Feb 3 - Jun 16 bear leg
- RES 2: 1.3968 High May 20
- RES 1: 1.3925 High Aug 22
- PRICE: 1.3858 @ 07:56 BST Aug 26
- SUP 1: 1.3803 20-day EMA
- SUP 2: 1.3775/22 50-day EMA / Low Aug 22
- SUP 3: 1.3576 Low Jul 23
- SUP 4: 1.3557/40 Low Jul 3 / Low Jun 16 and the bear trigger
Gains last week in USDCAD and the breach of resistance at 1.3879, the Aug 1 high, continues to highlight a bullish phase. Moving average studies have recently crossed and are in a bull-mode position, strengthening the current uptrend. An extension higher would signal scope for a climb towards 1.4019, a Fibonacci retracement. On the downside, support to watch lies at 1.3775, the 50-day EMA. A break of the EMA would signal a reversal.
AUDUSD TECHS: Finds Support
- RES 4: 0.6688 High Nov 7 ‘24
- RES 3: 0.6677 0.764 proj of the Jun 23 - Jul 11 - 17 price swing
- RES 2: 0.6569/6625 High Aug 14 / 24 and the bull trigger
- RES 1: 0.6524 High Aug 18
- PRICE: 0.6480 @ 07:52 BST Aug 26
- SUP 1: 0.6415 Low Aug 21 / 22
- SUP 2: 0.6373 Low Jun 23
- SUP 3: 0.6354 38.2% retracement of the Apr 9 - Jul 24 upleg
- SUP 4: 0.6323 Low Apr 16
AUDUSD rallied last Friday and for now, the pair is holding on to its latest gains. The rally signals the end of the recent corrective phase. A continuation higher would signal scope for a climb towards 0.6569, the Aug 14 high. Key resistance and the bull trigger is at 0.6625, the Aug 24 high. On the downside, support to watch lies at 0.6415, the Aug 21 / 22 low. A clear break of it would resume the bear leg.