US TSYS: Yields Drift Lower
The TYU5 range has been 110-31 to 111-04+ during the Asia-Pacific session. It last changed hands at 111-03+, up 0-03 from the previous close.
- The US 2-year yield has shifted lower trading around 3.92.4%, down 0.01 from its close.
- The US 10-year yield has edged lower trading around 4.352%, down 0.01 from its close.
- The 10-year yield has again held the support around its pivot within the wider range 4.10% - 4.65%, decent supply was seen around the 4.30/35% area once more. This would need to clear above the 4.45% area to potentially regain upward momentum now.
- Nick Timiraos on X: ”September’s Fed decision hinges on data clarity. If the recent muddle persists, that “could make it very tough—if it’s not bad enough to make it a slam dunk to cut, and it is not good enough to declare victory,” says Rich Clarida.”
- “Powell gives the Heisman stiff-arm to any attempt to get pinned down on September. Responding to a leading hypothetical on what would generate a rate cut in September: "I'm not going to say that, no. We're just going to need to see the data. It could go in many different directions." "We're going to make a judgment based on all of the data and based on the balance-of-risks analysis."
- Data/Events: Challenger Job Cuts, Personal Income, PCE, ECI, Initial Jobless Claims, MNI Chicago PMI
Fig 1: 10-Year US Yield 120min Chart
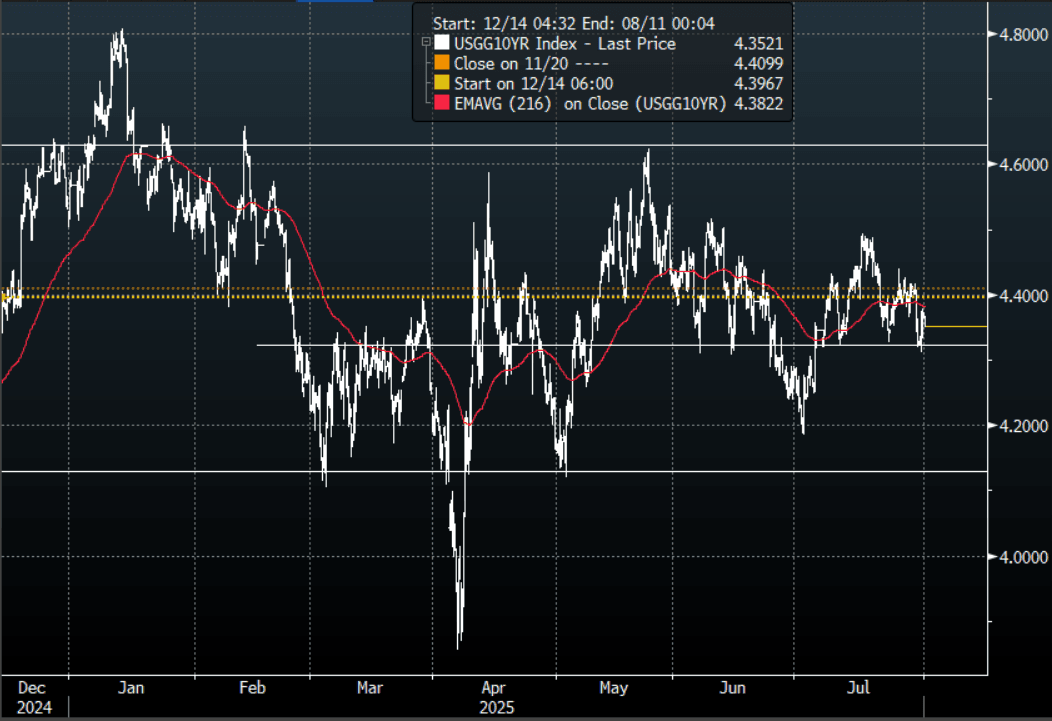
Source: MNI - Market News/Bloomberg Finance L.P
Want to read more?
Find more articles and bullets on these widgets:
Historical bullets
NZD: Asia Wrap - NZD/USD Dips Well Supported
The NZD/USD had a range of 0.6076 - 0.6097 in the Asia-Pac session, going into the London open trading around 0.6095, -0.03%. A tight range in a relatively quiet Asian session, US Equity futures have also drifted lower in Asia, ESU5 -0.1%, NQU5 -0.1%. The pair is trying to break through its recent highs and build momentum for a potential look back towards the 0.6400/0.6500 area. The relentless pressure on the USD is providing a tailwind and dips towards 0.6000 should continue to see demand.
- (Bloomberg) -- ANZ Bank New Zealand Chief Economist No longer sees RBNZ cutting cash rate at July 9 decision, predicting instead it will keep the rate at 3.25%
- “From there, we are now forecasting a cautious pace of cutting with 25bp cuts in August and November, with a third 25bp cut in February to 2.50% best interpreted as a placeholder for global headwinds, particularly confidence impacts”
- Q2 NZIER Business Confidence Firms, But Lack Of Demand Cited : "A net 27 percent of firms expect an improvement in general economic conditions over the coming months on a seasonally adjusted basis, which was a further lift from the net 23 percent in the March quarter."
- A huge bounce from sub 0.5900 and the NZD has now established a foothold above 0.6000, with the USD breaking lower the NZD/USD looks to be building for a potential break higher of its own. A clear break of 0.6100 could provide the momentum to begin a larger move higher, initially targeting the 0.6400/0.6500 area.
- CFTC Data shows Asset Managers have cut their shorts and are now beginning to build a long in NZD +12195, the Leveraged community maintained their short that had just been added to -11981.
- Options : Closest significant option expiries for NY cut, based on DTCC data: none. Upcoming Close Strikes : 0.5850(NZD404m July 1), 0.5800(649m July2)
- AUD/NZD range for the session has been 1.0784 - 1.0801, currently trading 1.0790. The cross is struggling to get any momentum for now. It looks to be in a 1.0750 - 1.0850 range for now as it awaits a catalyst to provide some clearer direction.
Fig 1: NZD/USD Spot Weekly Chart
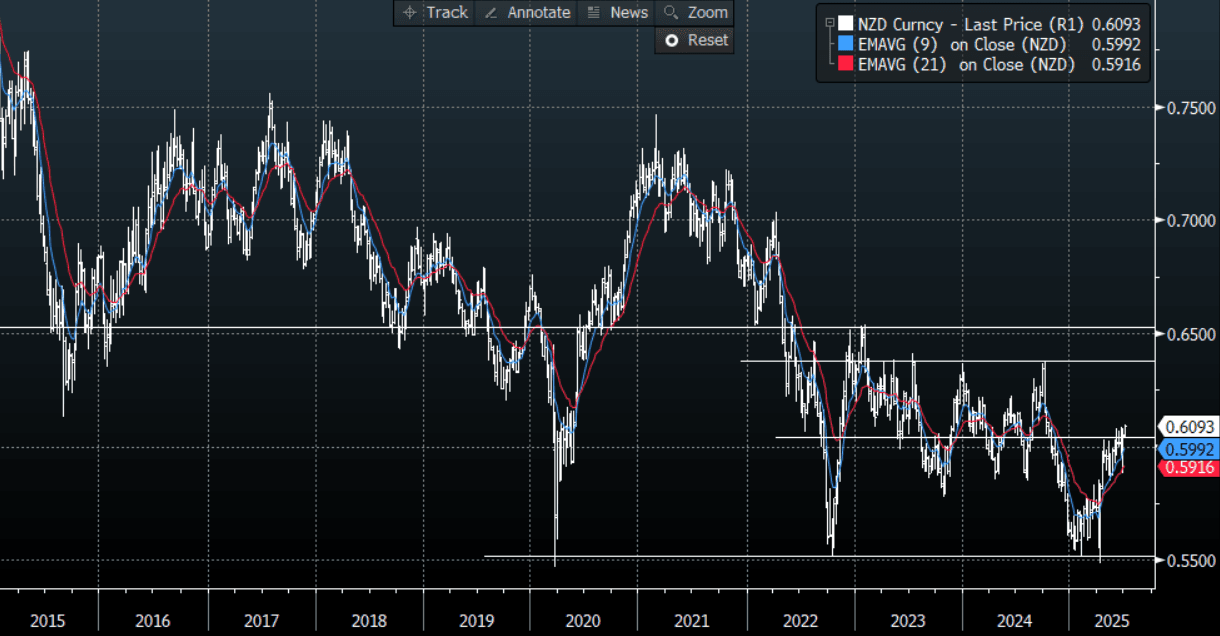
Source: MNI - Market News/Bloomberg Finance L.P
JPY: Asia Wrap - USD/JPY Tests Lower After Strong Tankan, Finds Demand 143.50
The Asia-Pac USD/JPY range has been 143.44 - 144.08, Asia is currently trading around 143.85, -0.15%. USD/JPY has tested lower in our session, a strong Tankan survey has the market contemplating a potential rate hike once more. The bias remains to sell USD’s on rallies, 144.50/145.00 first resistance with the focus now turning back towards the 142.00 area.
- The Q2 Tankan survey delivered some positive upside surprises. The large manufacturing index rose to 13, versus 10 forecast and 12 prior. The outlook for this segment was also better than forecast, printing at 12 (9 was forecast and 12 was the Q1 outcome). The all industry capex estimate was also stronger than expected, coming in at 11.5%, versus 10.0% forecast (3.1% was the prior outcome). For large non-manufacturing firms, the results were slightly less positive, with headline index at 34, in line with forecast, while prior was 35. The outlook printed at 27, below the expected 29 outcome (28 was recorded in Q1).
- AKAZAWA: “TWO SIDES ARE NOT ON THE SAME PAGE ON SOME MATTERS, WON'T COMMENT ON WHETHER RICE IS PART OF U.S. TARIFF TALKS, STILL EXPLORING IF POSSIBLE TO REACH TRADE AGREEMENT" - BBG
- The rejection of 148.00 points to a potential top being in place now and shows just how quick the market is to return to selling USD’s.
- USD/JPY is drifting back to the lower band of its 142.00 - 148.00 range, while the USD continues to move lower this should continue to see sellers on any bounce for now.
- CFTC data shows Asset managers paring back their JPY longs very slightly +93003, while leveraged funds added to their longs again trying to rebuild their position +15935.
- Options : Close significant option expiries for NY cut, based on DTCC data: 145.00($1.02b), 143.50(559m).Upcoming Close Strikes : 140.00($1.11b July3), 139.75($1.05b July 3).
Fig 1 : USD/JPY Spot Daily Chart
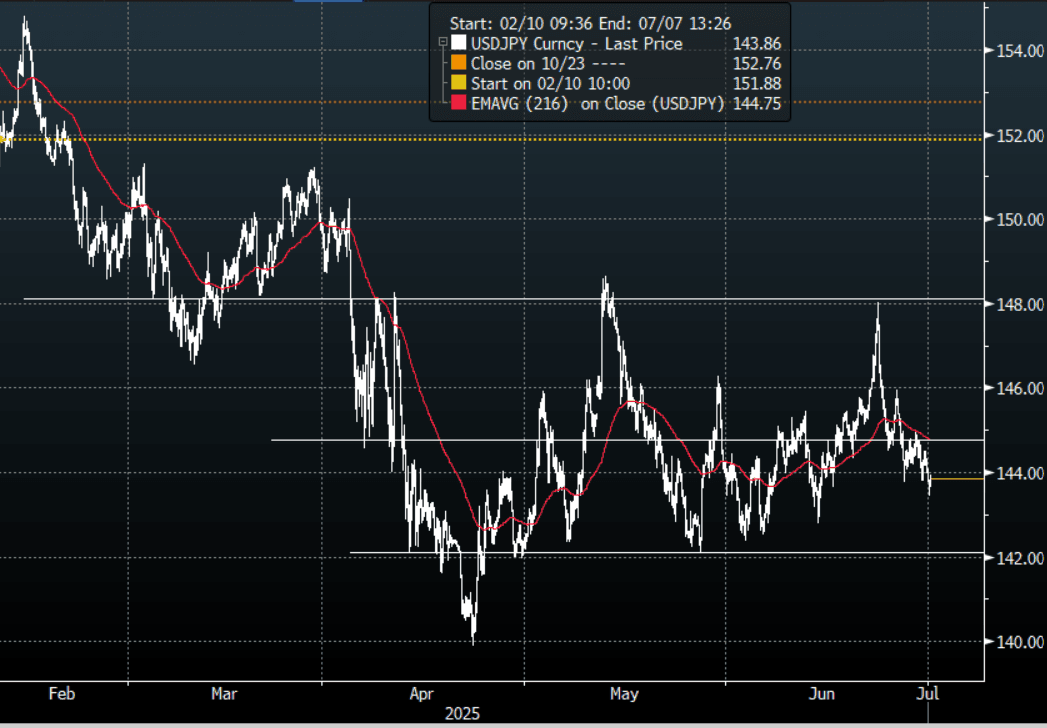
Source: MNI - Market News/Bloomberg Finance L.P
AUD: Asia Wrap - AUD/USD Falters Towards 0.6600
The AUD/USD has had a range of 0.6554 - 0.6584 in the Asia- Pac session, it is currently trading around 0.6570, -0.2%. The pair has drifted lower today, the headwind looks to be from AUD/JPY selling. US Equity futures have also drifted lower in Asia, ESU5 -0.1%, NQU5 -0.1%. CFTC data out for last week shows both Asset Managers and Leveraged Funds added to their AUD short positions, given how poorly the USD is trading one would expect most of these shorts are being expressed in the crosses where the AUD has traded poorly particularly against the EUR and GBP. Should AUD/USD begin to build momentum higher even these crosses will start to be challenged.
- CHINA CAIXIN PMI Surprises to the Upside: China's CAIXIN PMI Manufacturing in June rose to 50.4, ahead of an expected 49.3. The index was considerably up from the prior month's result of 48.3. This data captures the period post the agreement between the US and China on tariffs and potentially points to an improvement in activity.
- (Bloomberg) - "Australian home prices climbed a fifth straight month, fueled by the Reserve Bank’s two interest-rate cuts this year and expectations of more to come."
- The AUD/USD is breaking through the top of its recent range as the pressure on the USD increases.
- The AUD needs a sustained break above 0.6550/0.6600 to potentially start building momentum for an extended move higher, a close back above 0.6600 and the focus would turn back to 0.6900/0.7000.
- Options : Closest significant option expiries for NY cut, based on DTCC data: 0.6560(AUD874m). Upcoming Close Strikes : 0.6750(AUD1.27b July 2), 0.6600(AUD2.55bm July4).
- AUD/JPY - Today's range 94.24 - 94.82, it is trading currently around 94.40, -0.40%. Choppy price action as the pair establishes a range between 92.00 - 96.00. Momentum higher seems to be stalling, a break sub 0.9350 could signal a top is in place.
Fig 1: AUD/USD spot Weekly Chart
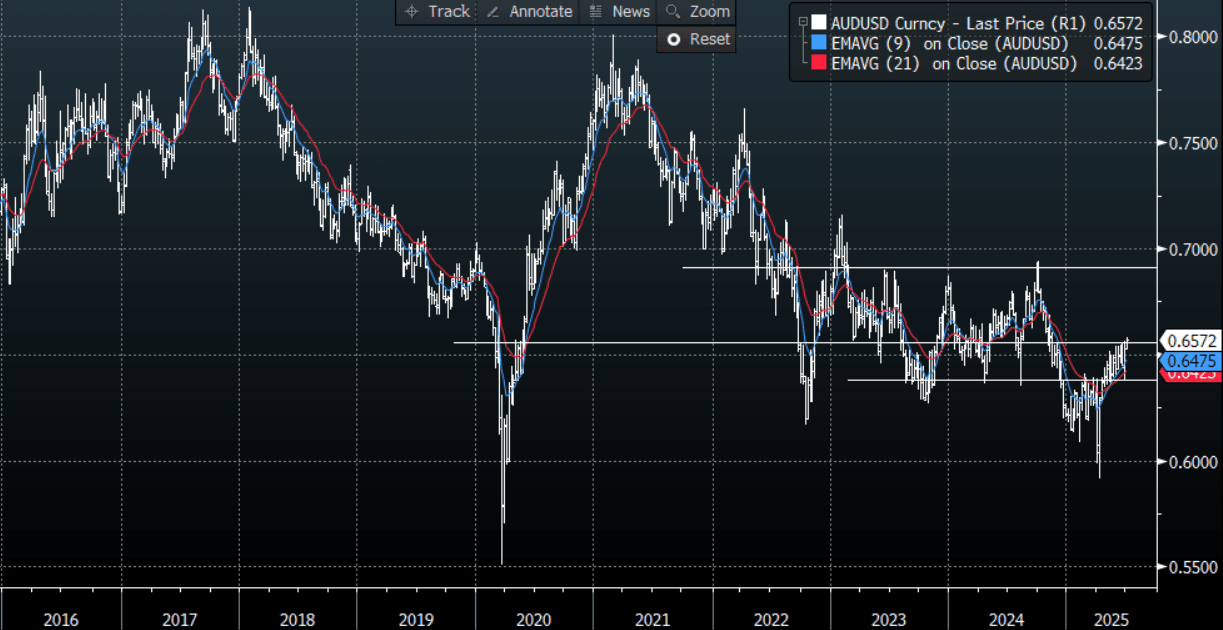
Source: MNI - Market News/Bloomberg Finance L.P