ASIA STOCKS: White House Rumours Roil Tech, Shenzhen Bounces of Key Tech Level
News that the White House is considering export restrictions on critical software to China was enough to push on a tech sector already reaching new highs and investors seemingly willing to take profit (as per Reuters). Samsung lead the KOSPI down just as TSMC did in Taiwan, whilst Softbank was key contributor to the NIKKEI's decline. The news adds to the already heightened level of concern around US China tensions and with many bourses in the region at new highs, profit taking appears a key driver of risk appetite at present.
- The NIKKEI has retreated off its new highs, down -1.4% today with a -690pt decline. The NIKKEI maintains its position above all major moving averages, all of which remain upward sloping, an indication that the positive momentum could continue.
- The KOSPI is lower by -0.55% after closing Wednesday at new highs of 3,883 yet remains up over 3% for the week.
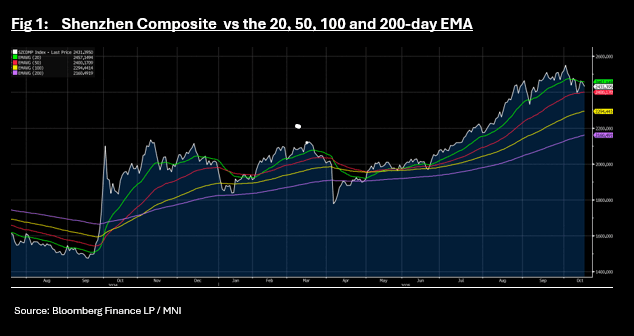
- The Hang Seng has done very little all day as it trends around the 50-day EMA of 25,851 as the fall of -0.5% by the CSI 300 sees it near to the 20-day EMA of 4,561. The Shanghai Comp is down -0.6% and Shenzhen the largest faller, down -0.8%, bouncing off the 20-day EMA of 2,457 it trended below this week. Below the 50-day EMA is at 2,400.
- The NIFTY 50 is trending higher again on suggestions that a US trade deal is closer, and is up +0.50% in morning trade to reach a new high of 26,002 pushing further above all major moving averages.
Want to read more?
Find more articles and bullets on these widgets:
Historical bullets
CHINA: Bond Futures Take Back Yesterday's Gains
- Bond Futures are lower in China today, wiping out the gains from yesterday.
- The 10-Yr is lower by -0.21 at 107.73 after yesterday's gains of +0.19. The 10-Yr remains below all major moving averages.
- The 2-Yr is lower by -0.04 at 102.35 to push further below all major moving averages. The 20-day EMA above is at 102.39.
- At 1.80%, the 10-YR CGB is at the top end of the 1.70-1.80% range it has traded in since early August.
JAPAN: Koziumi Still Seen As Favorite For LDP Leadership Race
Earlier headlines crossed from Japan LDP leadership candidates. Notably from Takaichi we got, via Rtrs, :"JAPANESE PM CONTENDER TAKAICHI: WILL USE TAX REVENUES TO FUND TAX CUT, SPENDING FOR STEPS TO COMBAT RISING PRICES BUT IF NECESSARY, SHOULD ISSUE BONDS.
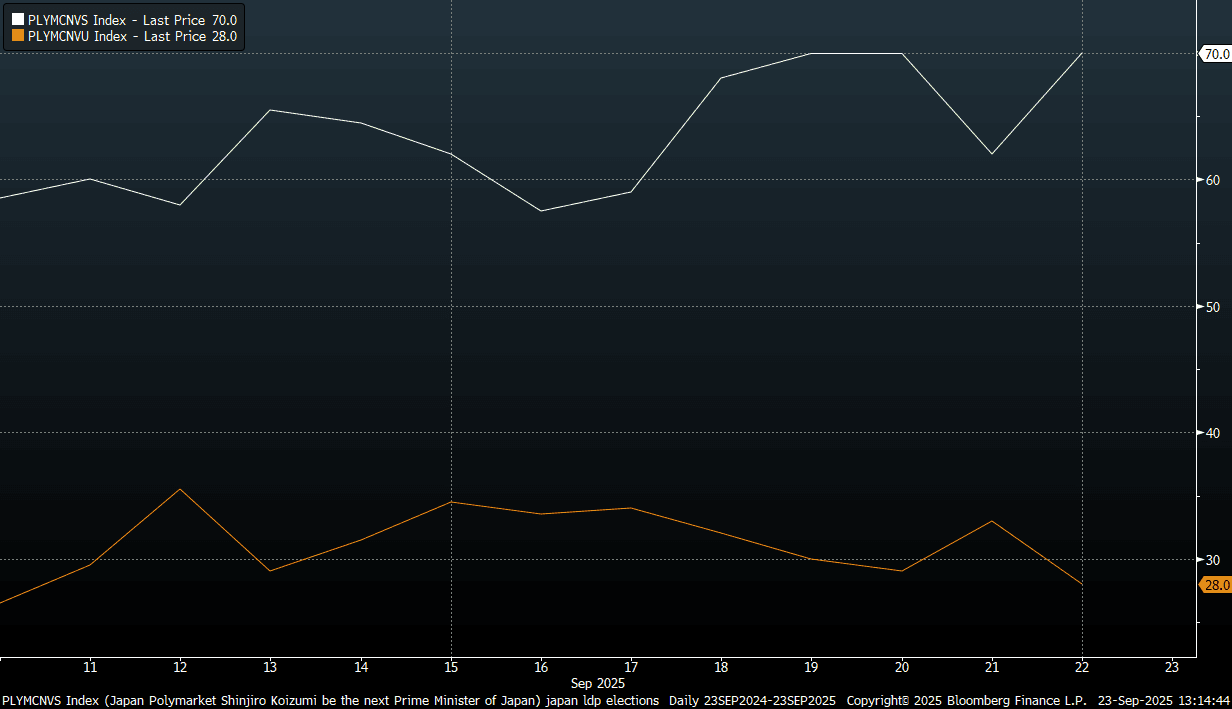
- This fits with Takaichi's known fiscal expansion viewpoint. Still, she sits well down per Polymarket odds, last around 28, off recent highs.
- Koizumi continues to lead, last at highs of 70 (since the LDP election was called a few weeks ago), see the chart below (Koizumi odds are the white line, Takaichi the orange line). Still, Takaichi remains the top pick among onshore opinions.
- Koizumi noted earlier: KOIZUMI: MUST BE MINDFUL OF NEED FOR FISCAL DISCIPLINE, BUT ACHIEVING SOLID ECONOMIC GROWTH IS BASIS FOR GUIDING SOUND FISCAL POLICY - [RTRS]"
- His remarks are more in line with a status quo fiscal outcome, although changes can't be ruled out.
- The JGBs 2/30s curve has flattened of late, last +225bps, we were around +245bps in early September. Nevertheless, the 2/30 curve remains near its steepest since 2005.
- The LDP election is scheduled for Oct 4.
Fig 1: Koizumi Clear Front Runner For LDP Leadership Race - Per Polymarket
Source: Polymarket/Bloomberg Finance L.P./MNI
AUSSIE BONDS: AU-US 10Y Diff In Top Half Of Range
Cash ACGBs are 2bps cheaper today.
- The AU-US 10-year yield differential is currently around +12bps, placing it in the top half of the ±30bps range that has persisted since November 2022.
- A simple regression of the 10-year yield differential against the AU-US 1-year forward 3-month swap rate (1Y3M) differential over the past two years suggests that the current spread is close to fair value.
- The 1Y3M differential, a key measure of expected relative policy paths over the next 12 months, has increased by approximately 60bps since June, reaching a level similar to October 2024.
Figure 1: AU-US Cash 10-Year Yield Differential (%)
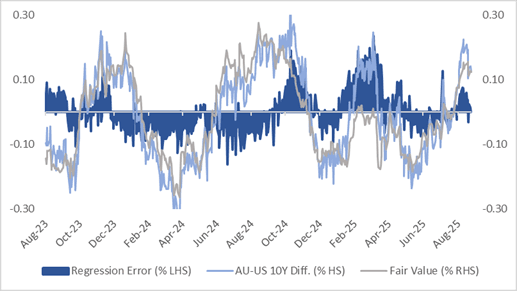
Source: Bloomberg Finance LP / MNI