PRECIOUS METALS: Waiting For US Payrolls, Trade Decision & Watch Geopolitics
Gold & silver were lower on Wednesday but have started Thursday's APAC session higher. They were pre...
Want to read more?
Find more articles and bullets on these widgets:
Historical bullets
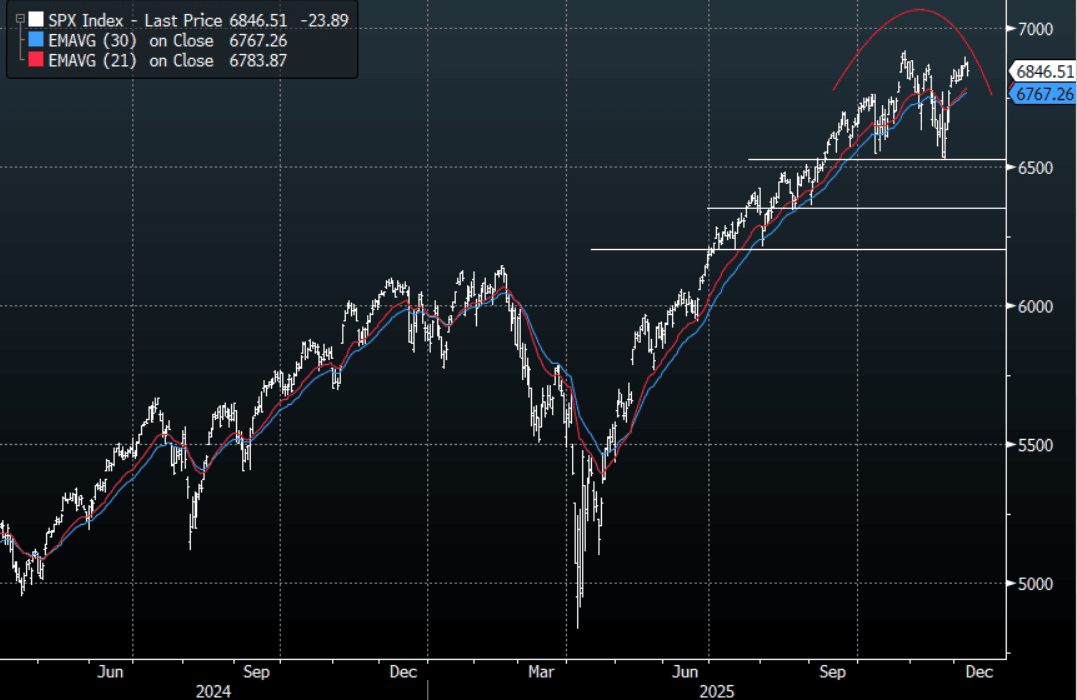
US STOCKS: S&P(ESZ5)-Bounces In Asia On Nvidia News, Does This Trump US Yields ?
The S&P(ESZ5) overnight range was 6835.25 - 6893.75, SPX closed -0.35%, Asia is currently trading around 6863. Risk stalled again overnight and then started to move lower in reaction to the extension higher once again in US yields as treasuries got sold as we approach the FOMC. This morning's news that Trump is to allow Nvidia to ship its H200 products to approved customers in China has seen the market bounce off the overnight lows. This has seen the futures open a little higher, E-minis(S&P) +0.15%, NQZ5 +0.25%. On the day, I think the move in yields should be taking precedence over the sales of a chip to China that they might not even want. Look for sellers to potentially return in the 6870-6890 area for a retest of the overnight lows. Only a move back below 6700-6750 would signal a deeper correction may be on the cards so expect demand again on dips.
- The FOMC will be important this week with the market pricing in rate cuts, how many dissenters are needed to put a dent in this bullish view ?
- Jon Turek on X: “Market seems to be doing a last cut trade as the Fed is about re-rate UR higher and core PCE lower.”
- Hedgie on X, “The Disconnect Deepens. The S&P 500 is up 16.8% year-to-date, but the bond market is flashing warning signs. Fed cuts rates while Treasury yields rise. Goldman says AI investment looks like 1997. The top 10% do half of consumer spending while car repos hit 3 million.”
- The S&P 500 Index Average True Range(ATR) for the last 10 Trading days: 61 Points
Fig 1: S&P 500 Index Daily Chart
Source: MNI - Market News/Bloomberg Finance L.P
MNI: UK NOV BRC TOTAL RETAIL SALES 1.4% Y/Y
- MNI: UK NOV BRC TOTAL RETAIL SALES 1.4% Y/Y
LOOK AHEAD: Economic Data Calendar 09/12/2025
| Date | GMT/Local | Period | Country | Release | Prior | Consensus | |
| 09/12/2025 | 0001/0001 | Nov | BRC Like-for-Like Sales y/y | 1.5 | -- | % | |
| 09/12/2025 | 0001/0001 | Nov | BRC Total Retail Sales y/y | 1.6 | -- | % | |
| 09/12/2025 | 0330/1430 | Interest Rate | 3.6 | 3.6 | % | ||
| 09/12/2025 | 0700/0800 | Oct | Trade balance exports m/m | 1.4 | -- | % | |
| 09/12/2025 | 0700/0800 | Oct | Trade balance imports m/m | 3.1 | -- | % | |
| 09/12/2025 | 0700/0800 | Oct | Trade balance m/m | 15.3 | -- | E (b) | |
| 09/12/2025 | 1000/1000 | Dec | Bid to Cover Ratio | -- | -- | % | |
| 09/12/2025 | 1100/0600 | Nov | NFIB Small Business Index | 98.2 | 98.3 | ||
| 09/12/2025 | 1355/0855 | 06-Dec | Redbook Retail Sales y/y (month) | 6.4 | -- | % | |
| 09/12/2025 | 1355/0855 | 06-Dec | Redbook Retail Sales y/y (week) | 7.6 | -- | % | |
| 09/12/2025 | 1500/1000 | Oct | JOLTS job openings level | 7227.0 | 7115.0 | (k) | |
| 09/12/2025 | 1500/1000 | Oct | Latest Job Openings Level Previous Revised | -- | -- | (k) | |
| 09/12/2025 | 1500/1000 | Oct | JOLTS quits rate | 1.9 | -- | % | |
| 09/12/2025 | 1500/1000 | Oct | JOLTS quits rate previous | -- | -- | % | |
| 09/12/2025 | 1700/1200 | Dec | Corn Ending Stocks current year | 2154 | -- | (m) | |
| 09/12/2025 | 1700/1200 | Dec | Corn Production current year | 16752 | -- | (m) | |
| 09/12/2025 | 1700/1200 | Dec | Corn yield per acre current year | 186.0 | -- | ||
| 09/12/2025 | 1700/1200 | Dec | Cotton Ending Stocks current year | 4.3 | -- | (m) | |
| 09/12/2025 | 1700/1200 | Dec | Cotton Production current year | 14.12 | -- | (m) | |
| 09/12/2025 | 1700/1200 | Dec | Soybeans - Ending Stocks current year | 290 | -- | (m) | |
| 09/12/2025 | 1700/1200 | Dec | Soybeans Production current year | 4253 | -- | (m) | |
| 09/12/2025 | 1700/1200 | Dec | Soybeans yield per acre current year | 53.0 | -- | ||
| 09/12/2025 | 1700/1200 | Dec | Wheat - Ending Stocks current year | 901 | -- | (m) | |
| 09/12/2025 | 1700/1200 | Dec | Wheat Production current year | 1985 | -- | (m) | |
| 09/12/2025 | 1800/1300 | Dec | Bid to Cover Ratio | 2.43 | -- | ||
| 10/12/2025 | 0130/0930 | Nov | CPI y/y | 0.2 | 0.7 | % | |
| 10/12/2025 | 0130/0930 | Nov | PPI y/y | -2.1 | -2.0 | % | |
| 10/12/2025 | 0700/0800 | Nov | CPI m/m | 0.3 | -- | % | |
| 10/12/2025 | 0700/0800 | Nov | CPI y/y | 3.3 | 2.7 | % | |
| 10/12/2025 | 0700/0800 | Nov | CPI-AT Alcohol and tobacco m/m | 0.1 | -- | % | |
| 10/12/2025 | 0700/0800 | Nov | CPI-AT Alcohol and tobacco y/y | 4.2 | -- | % | |
| 10/12/2025 | 0700/0800 | Nov | CPI-AT Energy products m/m | 0.0 | -- | % | |
| 10/12/2025 | 0700/0800 | Nov | CPI-AT Energy products y/y | 11.1 | -- | % | |
| 10/12/2025 | 0700/0800 | Nov | CPI-AT Food and non-alc. m/m | 0.6 | -- | % | |
| 10/12/2025 | 0700/0800 | Nov | CPI-AT Food and non-alc. y/y | 0.6 | -- | % | |
| 10/12/2025 | 0700/0800 | Nov | CPI-AT Rent m/m | 0.5 | -- | % | |
| 10/12/2025 | 0700/0800 | Nov | CPI-AT Rent y/y | 3.7 | -- | % | |
| 10/12/2025 | 0700/0800 | Nov | CPI-ATE Alcohol and tobac. m/m | 0.1 | -- | % | |
| 10/12/2025 | 0700/0800 | Nov | CPI-ATE Alcohol and tobac. y/y | 4.2 | -- | % | |
| 10/12/2025 | 0700/0800 | Nov | CPI-ATE Food and non-alc. m/m | 0.6 | -- | % | |
| 10/12/2025 | 0700/0800 | Nov | CPI-ATE Food and non-alc. y/y | 6.3 | -- | % | |
| 10/12/2025 | 0700/0800 | Nov | CPI-ATE Rent m/m | 0.5 | -- | % | |
| 10/12/2025 | 0700/0800 | Nov | CPI-ATE Rent y/y | 3.7 | -- | % | |
| 10/12/2025 | 0700/0800 | Nov | CPI-ATE m/m | 0.6 | -0.2 | % | |
| 10/12/2025 | 0700/0800 | Nov | CPI-ATE y/y | 3.4 | 3.1 | % | |
| 10/12/2025 | 0700/0800 | Nov | Private Sector Production m/m | -- | -- | % | |
| 10/12/2025 | 0900/1000 | Oct | Industrial Production m/m | 2.8 | -0.2 | % | |
| 10/12/2025 | 0900/1000 | Oct | Industrial Production y/y wda | 1.5 | -- | % | |
| 10/12/2025 | 1000/1000 | 12-Dec | Bid to Cover Ratio | -- | -- | ||
| 10/12/2025 | 1200/0700 | 05-Dec | MBA Mortgage Applications w/w | -1.4 | -- | % | |
| 10/12/2025 | 1200/0700 | Nov | IPCA Inflation m/m | 0.09 | 0.19 | % | |
| 10/12/2025 | - | Nov | M2 YTD y/y | 8.2 | 8.2 | % | |
| 10/12/2025 | - | Q3 | Social Financing | 30.90 | 33.10 | CNY (t) | |
| 10/12/2025 | - | Nov | New Loans | 14.97 | 15.39 | CNY (t) | |
| 10/12/2025 | 1330/0830 | Q3 | ECI | 0.9 | 0.9 | % | |
| 10/12/2025 | 1330/0830 | Q3 | ECI - Cur Q seas. adj. % change benefits from prev Q | 0.7 | -- | % | |
| 10/12/2025 | 1330/0830 | Q3 | ECI - Cur Q unadj y/y % change | 3.6 | -- | % | |
| 10/12/2025 | 1330/0830 | Q3 | ECI - Cur Q unadj y/y % change benefits cost | 3.5 | -- | % | |
| 10/12/2025 | 1330/0830 | Q3 | ECI - Prev Q seas. adj. % change benefits | -- | -- | % | |
| 10/12/2025 | 1330/0830 | Q3 | ECI - Prev Q unadj y/y % change | -- | -- | % | |
| 10/12/2025 | 1330/0830 | Q3 | ECI - Prev Q unadj y/y % change benefits cost | -- | -- | % | |
| 10/12/2025 | 1330/0830 | Q3 | ECI - Prev quarter | -- | -- | % | |
| 10/12/2025 | 1445/0945 | BOC Policy Decision | 2.25 | 2.25 | % | ||
| 10/12/2025 | 1530/1030 | 05-Dec | Crude Oil Domestic Production | 13815.0 | -- | bbl (k) | |
| 10/12/2025 | 1530/1030 | 05-Dec | Crude Oil Domestic Production w/w change | 1.0 | -- | bbl (k) | |
| 10/12/2025 | 1530/1030 | 05-Dec | Crude Oil Stock ex. SPR | 427503.0 | -- | bbl (k) | |
| 10/12/2025 | 1530/1030 | 05-Dec | Crude Oil Stocks ex. SPR w/w | 0.574 | -- | bbl (m) | |
| 10/12/2025 | 1530/1030 | 05-Dec | Cushing, Oklahoma Stocks | 21296.0 | -- | bbl (k) | |
| 10/12/2025 | 1530/1030 | 05-Dec | Cushing, Oklahoma Stocks w/w change | -457.0 | -- | bbl (k) | |
| 10/12/2025 | 1530/1030 | 05-Dec | Distillate Fuel Oil | 114286.0 | -- | bbl (k) | |
| 10/12/2025 | 1530/1030 | 05-Dec | Distillate Stocks w/w change | 2.059 | -- | bbl (m) | |
| 10/12/2025 | 1530/1030 | 05-Dec | Gasoline Stocks w/w change | 4.518 | -- | bbl (m) | |
| 10/12/2025 | 1530/1030 | 05-Dec | Refinery % Operable Utilization | 94.1 | -- | % | |
| 10/12/2025 | 1530/1030 | 05-Dec | Refinery % Operable Utilization change | 1.8 | -- | % | |
| 10/12/2025 | 1530/1030 | 05-Dec | Strategic Petroleum Reserve (SPR) | 411674.0 | -- | bbl (k) | |
| 10/12/2025 | 1530/1030 | 05-Dec | Strategic Petroleum Reserve (SPR) w/w change | 250.0 | -- | bbl (k) | |
| 10/12/2025 | 1530/1030 | 05-Dec | Total Motor Gasoline | 214422.0 | -- | bbl (k) | |
| 10/12/2025 | 1530/1030 | 06-Dec | Distillate Fuel Oil Products Supplied | 3430.0 | -- | bbl (k) | |
| 10/12/2025 | 1530/1030 | 06-Dec | Distillate Fuel Oil Products Supplied w/w change | 68.0 | -- | bbl (k) | |
| 10/12/2025 | 1530/1030 | 06-Dec | Finished Motor Gasoline Products Supplied | 8326.0 | -- | bbl (k) | |
| 10/12/2025 | 1530/1030 | 06-Dec | Finished Motor Gasoline Products Supplied w/w change | -400.0 | -- | bbl (k) | |
| 10/12/2025 | 1530/1030 | 06-Dec | Kerosene-Type Jet Fuel Products Supplied | 1717.0 | -- | bbl (k) | |
| 10/12/2025 | 1530/1030 | 06-Dec | Kerosene-Type Jet Fuel Products Supplied w/w change | 19.0 | -- | bbl (k) | |
| 10/12/2025 | 1530/1030 | 06-Dec | Other Oils Products Supplied | 5153.0 | -- | bbl (k) | |
| 10/12/2025 | 1530/1030 | 06-Dec | Other Oils Products Supplied w/w change | 395.0 | -- | bbl (k) | |
| 10/12/2025 | 1530/1030 | 06-Dec | Propane/Propylene Products Supplied | 1143.0 | -- | bbl (k) | |
| 10/12/2025 | 1530/1030 | 06-Dec | Propane/Propylene Products Supplied w/w change | -379.0 | -- | bbl (k) | |
| 10/12/2025 | 1530/1030 | 06-Dec | Residual Fuel Oil Products Supplied | 421.0 | -- | bbl (k) | |
| 10/12/2025 | 1530/1030 | 06-Dec | Residual Fuel Oil Products Supplied w/w change | 246.0 | -- | bbl (k) | |
| 10/12/2025 | 1530/1030 | 06-Dec | Total Products Supplied | 20189.0 | -- | bbl (k) | |
| 10/12/2025 | 1530/1030 | 06-Dec | Total Products Supplied w/w change | -51.0 | -- | bbl (k) | |
| 10/12/2025 | 1900/1400 | Nov | Treasury Budget Balance | -284.4 | -205.0 | USD (b) | |
| 10/12/2025 | 1900/1400 | Federal Funds Rate Range Maximum | 4.00 | 3.75 | % | ||
| 11/12/2025 | 0001/0001 | Nov | RICS house prices | -19 | -21 | % | |
| 11/12/2025 | 0030/1130 | Nov | Employed Persons change m/m | 42.2 | 20.0 | (k) | |
| 11/12/2025 | 0030/1130 | Nov | Labor Participation Rate | 67.0 | 67.0 | % | |
| 11/12/2025 | 0030/1130 | Nov | Unemployment Rate | 4.3 | 4.4 | % | |
| 11/12/2025 | 0700/0800 | Nov | CPIF Final y/y | 3.1 | 2.3 | % | |
| 11/12/2025 | 0700/0800 | Nov | CPIF-XE Final y/y | 2.8 | 2.4 | % | |
| 11/12/2025 | 0700/0800 | Nov | CPIF Final y/y | 3.1 | 2.3 | % | |
| 11/12/2025 | 0700/0800 | Nov | CPIF-XE Final y/y | 2.8 | 2.4 | % | |
| 11/12/2025 | 0830/0930 | Dec | SNB Policy Rate | 0.00 | 0.00 | % | |
| 11/12/2025 | 1100/0600 | Interest Rate | 39.50 | 38.25 | % | ||
| 11/12/2025 | 1330/0830 | 06-Dec | Continuing Claims | 1939.0 | 1945 | (k) | |
| 11/12/2025 | 1330/0830 | 06-Dec | Initial Jobless Claims | 191.0 | 220 | (k) | |
| 11/12/2025 | 1330/0830 | 06-Dec | Prev Continuing Claims, Rev | -- | -- | (k) | |
| 11/12/2025 | 1330/0830 | 06-Dec | Prev Initial Jobless Claims, Rev | -- | -- | (k) | |
| 11/12/2025 | 1330/0830 | 13-Nov | Corn Net Sales | 979.5 | -- | MT (k) | |
| 11/12/2025 | 1330/0830 | 13-Nov | Corn Weekly Exports | 1528.6 | -- | MT (k) | |
| 11/12/2025 | 1330/0830 | 13-Nov | Soy Net Sales | 510.6 | -- | MT (k) | |
| 11/12/2025 | 1330/0830 | 13-Nov | Soy Weekly Exports | 927.8 | -- | MT (k) | |
| 11/12/2025 | 1330/0830 | 13-Nov | Wheat Net Sales | 462.5 | -- | MT (k) | |
| 11/12/2025 | 1330/0830 | 13-Nov | Wheat Weekly Exports | 285.5 | -- | MT (k) | |
| 11/12/2025 | 1330/0830 | Q3 | Household cred mkt debt/income | -- | -- | % | |
| 11/12/2025 | 1330/0830 | Oct | Prev Trade Balance, Rev | -- | -- | CAD (b) | |
| 11/12/2025 | 1330/0830 | Oct | Trade Balance | 6.324 | -4.50 | CAD (b) | |
| 11/12/2025 | 1500/1000 | Q3 | Service Revenue | -- | -- | % | |
| 11/12/2025 | 1530/1030 | 05-Dec | Natural Gas Stocks w/w | -12.0 | -- | Bcf | |
| 11/12/2025 | 1800/1300 | Dec | Bid to Cover Ratio | 2.29 | -- | ||
| 12/12/2025 | 0430/1330 | Oct | Industrial Production m/m | 1.4 | -- | % | |
| 12/12/2025 | 0430/1330 | Oct | Industrial Production y/y | 1.5 | -- | % | |
| 12/12/2025 | 0700/0700 | Oct | GDP - 3m y/y | 1.3 | -- | % | |
| 12/12/2025 | 0700/0700 | Oct | GDP - 3m/3m | 0.1 | 0.0 | % | |
| 12/12/2025 | 0700/0700 | Oct | GDP - m/m | -0.1 | 0.1 | % | |
| 12/12/2025 | 0700/0800 | Nov | Unemployment rate NSA | 8.9 | -- | % | |
| 12/12/2025 | 0700/0800 | Nov | Unemployment rate NSA -1mo. Revised Prior | -- | -- | % | |
| 12/12/2025 | 0700/0800 | Nov | Unemployment rate NSA -2mo. Revised Prior | -- | -- | % | |
| 12/12/2025 | 0700/0800 | Nov | Unemployment rate SA | 9.3 | -- | % | |
| 12/12/2025 | 0700/0800 | Nov | Unemployment rate SA -1mo. Revised Prior | -- | -- | % | |
| 12/12/2025 | 0700/0800 | Nov | Unemployment rate SA -2mo. Revised Prior | -- | -- | % | |
| 12/12/2025 | 0700/0700 | Oct | Non-EU Trade Balance | -6.816 | -- | GBP (b) | |
| 12/12/2025 | 0700/0700 | Oct | Total Trade Balance | -1.094 | -- | GBP (b) | |
| 12/12/2025 | 0700/0700 | Oct | Visible Trade Balance | -18.883 | -19.100 | GBP (b) | |
| 12/12/2025 | 0700/0700 | Oct | Index of Services 3m/3m | 0.2 | 0.1 | % | |
| 12/12/2025 | 0700/0700 | Oct | Index of Services m/m | 0.2 | 0.0 | % | |
| 12/12/2025 | 0700/0700 | Oct | Industrial Production m/m | -2.0 | 0.9 | % | |
| 12/12/2025 | 0700/0700 | Oct | Industrial Production y/y | -2.5 | -1.2 | % | |
| 12/12/2025 | 0700/0700 | Oct | Manufacturing Output m/m | -1.7 | 1.0 | % | |
| 12/12/2025 | 0700/0700 | Oct | Manufacturing Output y/y | -2.2 | -0.3 | % | |
| 12/12/2025 | 0700/0800 | Nov | CPI (f) m/m | 0.3 | -0.2 | % | |
| 12/12/2025 | 0700/0800 | Nov | CPI (f) y/y | 2.3 | 2.3 | % | |
| 12/12/2025 | 0700/0800 | Nov | HICP (f) m/m | 0.3 | -0.5 | % | |
| 12/12/2025 | 0700/0800 | Nov | HICP (f) y/y | 2.3 | 2.6 | % | |
| 12/12/2025 | 0700/0700 | Oct | Construction Output 3M/3M | 0.1 | -- | % | |
| 12/12/2025 | 0700/0700 | Oct | Construction Output 3My/y | 1.5 | -- | % | |
| 12/12/2025 | 0700/0800 | Nov | CPI (f) m/m | 0.3 | -0.2 | % | |
| 12/12/2025 | 0700/0800 | Nov | CPI (f) y/y | 2.3 | 2.3 | % | |
| 12/12/2025 | 0700/0800 | Nov | HICP (f) m/m | 0.3 | -0.5 | % | |
| 12/12/2025 | 0700/0800 | Nov | HICP (f) y/y | 2.3 | 2.6 | % | |
| 12/12/2025 | 0745/0845 | Nov | CPI (f) m/m | 0.1 | -0.1 | % | |
| 12/12/2025 | 0745/0845 | Nov | CPI (f) y/y | 0.9 | 0.9 | % | |
| 12/12/2025 | 0745/0845 | Nov | Energy CPI (f) y/y | -5.6 | -4.6 | % | |
| 12/12/2025 | 0745/0845 | Nov | Food CPI (f) y/y | 1.3 | 1.4 | % | |
| 12/12/2025 | 0745/0845 | Nov | HICP (f) m/m | 0.1 | -0.2 | % | |
| 12/12/2025 | 0745/0845 | Nov | HICP (f) y/y | 0.8 | 0.8 | % | |
| 12/12/2025 | 0745/0845 | Nov | Manufactured Products CPI (f) y/y | -0.5 | -0.6 | % | |
| 12/12/2025 | 0745/0845 | Nov | Services CPI (f) y/y | 2.4 | 2.2 | % | |
| 12/12/2025 | 0745/0845 | Nov | Tobacco CPI (f) y/y | 4.1 | 4.1 | % | |
| 12/12/2025 | 0800/0900 | Nov | HICP (f) m/m | 0.5 | 0.0 | % | |
| 12/12/2025 | 0800/0900 | Nov | HICP (f) y/y | 3.2 | 3.1 | % | |
| 12/12/2025 | 0930/0930 | Q4 | BOE/Ipsos Infla Att 1yr | -- | -- | % | |
| 12/12/2025 | 0930/0930 | Q4 | BOE/Ipsos Infla Att 2yr | -- | -- | % | |
| 12/12/2025 | 0930/0930 | Q4 | BOE/Ipsos Infla Att 5yr | -- | -- | % | |
| 12/12/2025 | 0930/0930 | Q4 | BOE/Ipsos Inflation Attitudes | -- | -- | % | |
| 12/12/2025 | 1330/0830 | Oct | Building Permits | 4.5 | -1.5 | % | |
| 12/12/2025 | 1330/0830 | Oct | Wholesale Sales | 0.8 | -- | % | |
| 12/12/2025 | 1800/1300 | 12-Dec | Baker Hughes Canada Gas Rig Count | 65.0 | -- | ||
| 12/12/2025 | 1800/1300 | 12-Dec | Baker Hughes Canada Oil Rig Count | 126.0 | -- | ||
| 12/12/2025 | 1800/1300 | 12-Dec | Baker Hughes Canada Rig Count | 191.0 | -- | ||
| 12/12/2025 | 1800/1300 | 12-Dec | Baker Hughes US Gas Rig Count | 129.0 | -- | ||
| 12/12/2025 | 1800/1300 | 12-Dec | Baker Hughes US Oil Rig Count | 413.0 | -- | ||
| 12/12/2025 | 1800/1300 | 12-Dec | Baker Hughes US Rig Count | 549.0 | -- | ||
| 15/12/2025 | 2350/0850 | Q3 | Major mfg diffusion index | -- | -- | ||
| 15/12/2025 | 2350/0850 | Q3 | Major non-mfg DI | -- | -- | ||
| 15/12/2025 | 0200/1000 | ytd | Urban Fixed-Asset Investment y/y | -- | -- | % | |
| 15/12/2025 | 0200/1000 | Nov | Retail Sales y/y | -- | -- | % | |
| 15/12/2025 | 0200/1000 | Nov | Industrial Output y/y | -- | -- | % | |
| 15/12/2025 | 0200/1000 | Nov | Surveyed Unemployment Rate m/m | -- | -- | % | |
| 15/12/2025 | 1000/0500 | Nov | CREA Existing Home Sales Monthly | -- | -- | (k) | |
| 15/12/2025 | 1000/1100 | Oct | Industrial Production m/m | 0.2 | -- | % | |
| 15/12/2025 | 1000/1100 | Oct | Industrial Production m/m - Revised Prior | -- | -- | % | |
| 15/12/2025 | 1000/1100 | Oct | Industrial Production y/y | 1.2 | -- | % | |
| 15/12/2025 | 1000/1100 | Oct | Industrial Production y/y - Revised Prior | -- | -- | % | |
| 15/12/2025 | 1315/0815 | Nov | CMHC Housing Starts | -- | -- | (k) | |
| 15/12/2025 | 1330/0830 | Oct | Manufacturing Sales | -- | -- | % | |
| 15/12/2025 | 1330/0830 | Dec | Empire Manufacturing Index | -- | -- | ||
| 15/12/2025 | 1330/0830 | 20-Nov | Corn Net Sales | -- | -- | MT (k) | |
| 15/12/2025 | 1330/0830 | 20-Nov | Corn Weekly Exports | -- | -- | MT (k) | |
| 15/12/2025 | 1330/0830 | 20-Nov | Soy Net Sales | -- | -- | MT (k) | |
| 15/12/2025 | 1330/0830 | 20-Nov | Soy Weekly Exports | -- | -- | MT (k) | |
| 15/12/2025 | 1330/0830 | 20-Nov | Wheat Net Sales | -- | -- | MT (k) | |
| 15/12/2025 | 1330/0830 | 20-Nov | Wheat Weekly Exports | -- | -- | MT (k) | |
| 15/12/2025 | 1500/1000 | Dec | NAHB Home Builder Index | -- | -- |