JPY: USD/JPY - Finds Some Demand Sub 147.00
The Asia-Pac USD/JPY range has been 146.62 - 147.26, Asia is currently trading around 147.20, +0.05%. USD/JPY was capped by decent supply around 148.00 overnight and traded heavy into our open ignoring the big bounce in US Equities. Price has moved very quickly away from the pivotal 151/152 area much to the relief of Institutional JPY longs and the BOJ. CFTC Data shows leveraged accounts had started to aggressively build Yen shorts last week so this quick move lower would be a bitter pill to swallow. Price is tested the first support area around 146.50/147.00 where it found good demand this morning, a move sub 145.00 is needed to turn momentum lower once more, until then the 145.00-151-00 range should dominate.
- "AKAZAWA: WILL MULL COLLABORATION WITH US ON PHARMA SUPPLY, WILL WORK CLOSELY WITH US ON CHIP MANUFACTURING. CHIP, PHARMA ARE IMPORTANT FOR ECONOMIC SECURITY. WILL ALSO AIM TO BOOST INWARD DIRECT INVESTMENT" - BBG - BBG
- "ISHIBA: BELIEVE TRADE DEAL DAMAGE TO AUTO INDUSTRY MINIMAL, DEAL IS WIN-WIN BASED ON JAPAN'S TECH, US LABOR AND MKT. LIMITING IMPACT OF TRADE DEAL ON JAPAN FARMERS CRITICAL, TRADE DEAL DOESN'T AFFECT JAPAN'S RICE FARMERS" - BBG
- Bloomberg - “MUFG CEO Hironori Kamezawa called on the BOJ to raise its policy rate as early as the next meeting to combat strong inflation.”
- “Japan is set to shift its policy on rice to focus on boosting production, moving away from adjusting output to maintain price stability, Nikkei reported.” - BBG
- Options : Close significant option expiries for NY cut, based on DTCC data: 144.00($1.13b).Upcoming Close Strikes : 147.00($1.31b Aug 6), 148.50($1.24b Aug 7) - BBG.
- CFTC data shows asset managers surprisingly added slightly to their JPY longs +75119( Last +72326), while leveraged funds aggressively added to their newly built short JPY position -31280(Last -11571).
Fig 1 : USD/JPY Spot 120min Chart
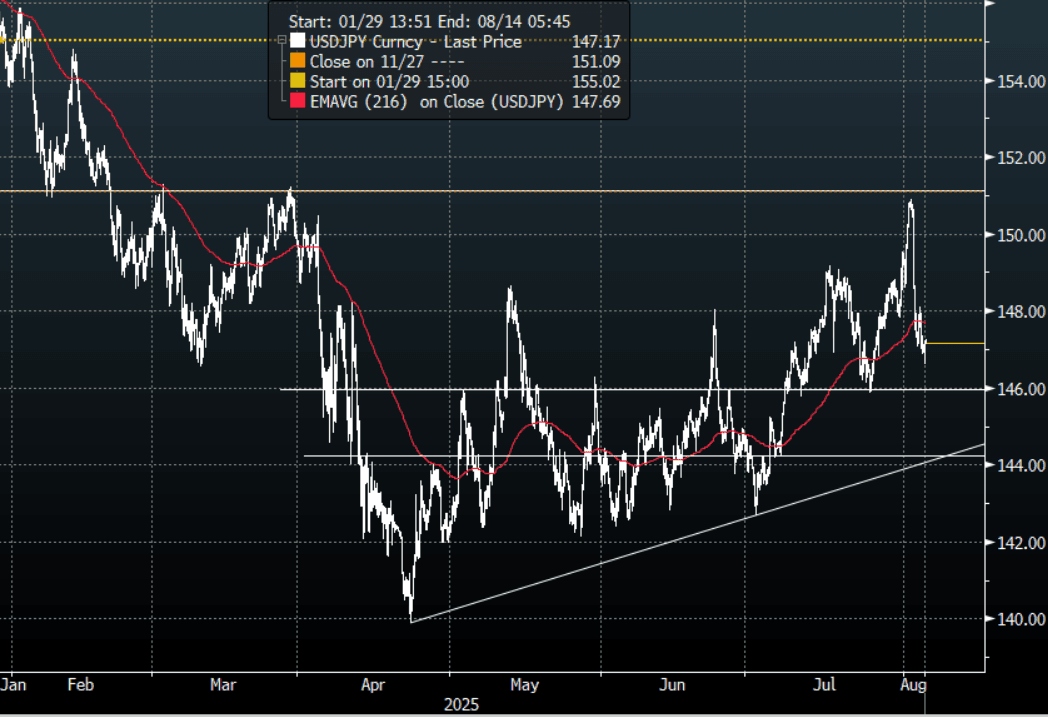
Source: MNI - Market News/Bloomberg Finance L.P
Want to read more?
Find more articles and bullets on these widgets:
Historical bullets
USDCAD TECHS: Trend Outlook Remains Bearish
- RES 4: 1.4111 High Apr 4
- RES 3: 1.4016 High May 12 and 13 and a key resistance
- RES 2: 1.3920 High May 21
- RES 1: 1.3674/3776 20- and 50-day EMA values
- PRICE: 1.3607 @ 16:12 BST Jul 4
- SUP 1: 1.3557 Low Jul 03
- SUP 2: 1.3540 Low Jun 16 and the bear trigger
- SUP 3: 1.3503 1.618 proj of the Feb 3 - 14 - Mar 4 price swing
- SUP 4: 1.3473 Low Oct 2 2024
The trend needle in USDCAD points south and this week’s move down reinforces current conditions. S/T gains between Jun 16 - 23 appear to have been corrective. Key support and the bear trigger is 1.3540, Jun 16 low. Clearance of this level would resume the downtrend and open 1.3503, a Fibonacci projection. Pivot resistance is at the 50-day EMA, at 1.3776. A clear break of this average would signal scope for a stronger recovery.
AUDUSD TECHS: Bull Cycle Remains In Play
- RES 4: 0.6700 76.4% retracement of the Sep 30 ‘24 - Apr 9 bear leg
- RES 3: 0.6688 High Nov 7 ‘24
- RES 2: 0.6603 High Nov 11 ‘24
- RES 1: 0.6590 High Jul 01
- PRICE: 0.6548 @ 16:05 BST Jul 04
- SUP 1: 0.6521 20-day EMA
- SUP 2: 0.6468/6373 50-day EMA / Low Jun 23 and a reversal trigger
- SUP 3: 0.6357 Low May 12
- SUP 4: 0.6275 Low Apr 14
The trend set-up in AUDUSD remains bullish and the pair is holding on to its recent gains. The latest break higher maintains the bullish price sequence of higher highs and higher lows, the definition of an uptrend. Moving average studies are in a bull-mode position, highlighting a dominant uptrend. Sights are on 0.6603 next, the Nov 11 2024 high. Key short-term support has been defined at 0.6373, the Jun 23 low.
EURJPY TECHS: Northbound
- RES 4: 171.88 High Jul 19 ‘24
- RES 3: 171.28 1.382 proj of the Feb 28 - Mar 18 - Apr 7 price swing
- RES 2: 171.09 High Jul 23 ‘24
- RES 1: 170.61 High Jul 03
- PRICE: 170.22 @ 16:04 BST Jul 04
- SUP 1: 169.04 Low Jul 02
- SUP 2: 167.87 20-day EMA
- SUP 3: 167.13 Low Jun 20
- SUP 4: 165.66 50-day EMA
EURJPY traded higher on Thursday resulting in a print above 170.47, the 76.4% retracement of the Jul 11 - Aug 5 sell-off. A clear break of this price point would strengthen bullish conditions and signal scope for extension. This would open 170.28 next, a Fibonacci projection. The trend is overbought, a pullback would unwind this condition. Support to watch lies at 167.87, the 20-day EMA.