ASIA FX: USD Sell-off Pauses, TWD REER Back Close To 2021 Highs
In North East Asian markets, recent USD weakness has consolidated today. Focus remains on USD/TWD, where spot losses have stabilized above 30.00, while the 1month NDF has lost around 4% in TWD terms. USD/CNH is higher but away from the best levels. The 1 month USD/KRW NDF is higher as well, but like USD/CNH away from best levels.
- In contrast to last Friday and yesterday, USD/TWD spot has had a much quieter session. Dips just under 30.00 have been supported so far and we last tracked near 30.15/20, off 0.25% in WTD terms and close to session highs. Given the very sharp nature of the collapse in the pair over the prior two sessions, if we have more USD selling to come through from exporters/lifers etc, upticks should be sold. Equally the authorities may be mindful of further sharp gains, as exporters worry about a sharp loss of competitiveness in the near term. The Citibank TWD REER has risen quickly back close to late 2021 highs, see the chart below. The 1 month NDF was last near 29.50/55, so still with a negative basis to onshore spot, but a significantly lower gap.
- USD/CNH opened around 7.2000 but rose as the USD found some support through the session. We had a close to unchanged USD/CNY fixing, with the authorities seemingly not adding any fresh fuel to recent yuan rally. The lower than expected Caixin services PMI also reminded markets of the growth risks from US tariffs. Highs in USD/CNH were around 7.2350/55, but as the USD has lost momentum we now sit back at 7.2135/40.
- 1 month USD/KRW has risen, the pair got to highs of 1387.69, but we sit back at 1377/78 in latest dealings, around 0.35% weaker in KRW terms. Onshore markets return tomorrow, with focus likely to be on whether we can see spot levels sustain sub 1400.
Fig 1: Citi TWD REER Back Close To 2021 Highs
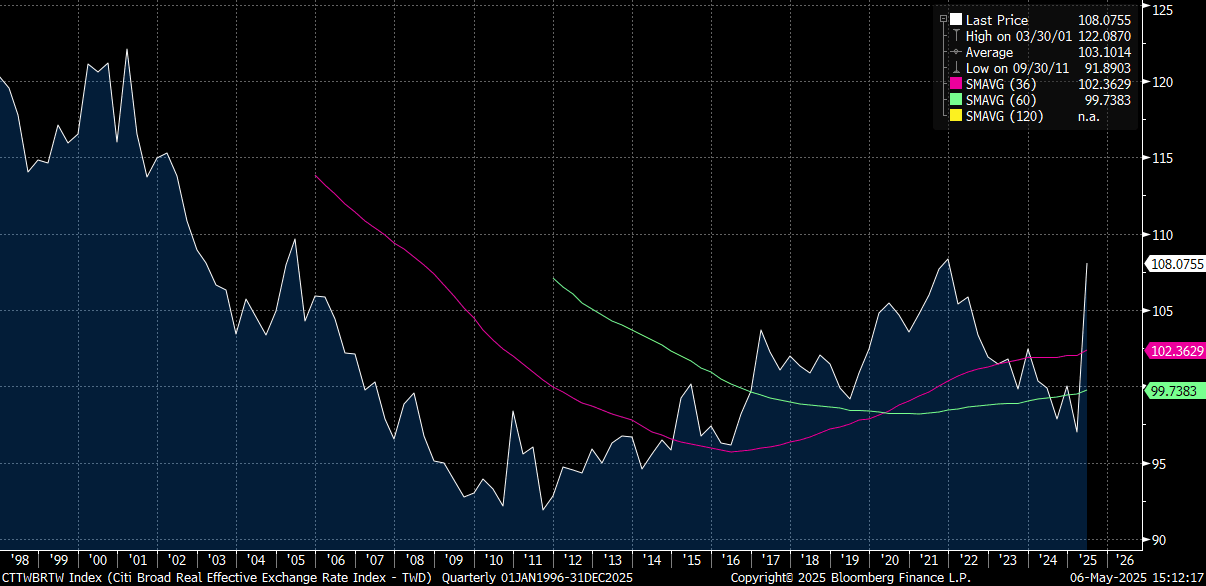
Source: Citi/MNI - Market News/Bloomberg
Want to read more?
Find more articles and bullets on these widgets:
Historical bullets
AUSSIE 10-YEAR TECHS: (M5) Strong S/T Bounce
- RES 3: 96.501 - 76.4% of the Mar 14 - Nov 1 ‘23 bear leg
- RES 2: 96.207 - 61.8% of the Mar 14 - Nov 1 ‘23 bear leg
- RES 1: 95.915 - High Apr 4
- PRICE: 95.860 @ 16:42 GMT Apr 04
- SUP 1: 95.420/95.300 - Low Feb 13 / Low Jan 14
- SUP 2: 95.275 - Low Nov 14 (cont) and a key support
- SUP 3: 94.640 - 1.0% 10-dma envelope
Aussie 10-yr futures extended a recent strong bounce through to the Friday close, putting prices through the top end of the recent range. The confirmed breach of 95.851, the Dec 11 high on the continuation contract, reinstates a bull cycle and focuses attention on resistance at 96.207, a Fibonacci retracement point. A stronger bearish theme would expose 95.275, the Nov 14 low and a key support. Clearance of this level would strengthen a bearish condition.
USDCAD TECHS: Bearish Structure
- RES 4: 1.4452/4543 High Mar 13 / 4 and a bull trigger
- RES 3: 1.4415 High Apr 1
- RES 2: 1.4308 50-day EMA
- RES 1: 1.4242 High Apr 4
- PRICE: 1.4196 @ 17:10 BST Apr 4
- SUP 1: 1.4028 Low Apr 3
- SUP 2: 1.3986 Low Dec 2 ‘24
- SUP 3: 1.3944 61.8% retracement of Sep 25 ‘24 - Feb 3 bull run
- SUP 4: 1.3894 Low Nov 11 ‘24
USDCAD rallied Friday, but remains lower on the week after Thursday’s downleg. The move down has confirmed a clear reversal of the bull cycle between Sep 25 ‘24 and Feb 3. Price is through a key support at 1.4151, the Feb 14 low. This signals scope for an extension towards 1.3944, a Fibonacci retracement. On the upside, key short-term resistance is seen at 1.4308, the 50-day EMA.
CANADA DATA: Unexpected Jobs Contraction Boosts Implied April BOC Cut Chances
Canadian employment unexpectedly contracted in March, falling by the most since January 2022 at -32.6k (+10.0k expected, +1.1k prior) in a sign that the trade war with the US is spilling over increasingly into the "hard" data. The unemployment rate ticked up 0.1pp to 6.7%, in line with expectations and below the November 6.9% high, though unrounded it rose from 6.55% to 6.71% - the largest increase since November.
- The drop in employment was largely due to a 62.0k drop in full-time positions (after -19.7k, the 2nd straight drop), with part-time up for the 4th consecutive month at 29.5k (after 20.8k prior) - that mix is clearly indicative of hiring uncertainty among firms.
- The monthly full-time drop was the 2nd largest since the pandemic lows in the labour market (April 2020). Goods producing jobs fell by 12k (2nd consecutive decline), while services shed 21k (wholesale/retail trade and Information, culture and recreation led losses).
- The participation rate dipped 0.1pp to 65.2%.
- Wages were soft, dropping 0.2% M/M for the first drop since November, with the Y/Y rate slipping to 3.6% from 3.8% prior. The rise in permanent employees' wages of 3.5% Y/Y was well below the 4.1% expected (4.0% prior).
- Market-implied probability of an April BOC rate cut rose to as high as 68% after the data before settling the day at around 55%. That compares to 40% prior to Wednesday's US tariffs announcement.

