USD Index (DXY) Tests A Long-Term Trendline Support

Jul-02 10:38By: Taso Anastasiou
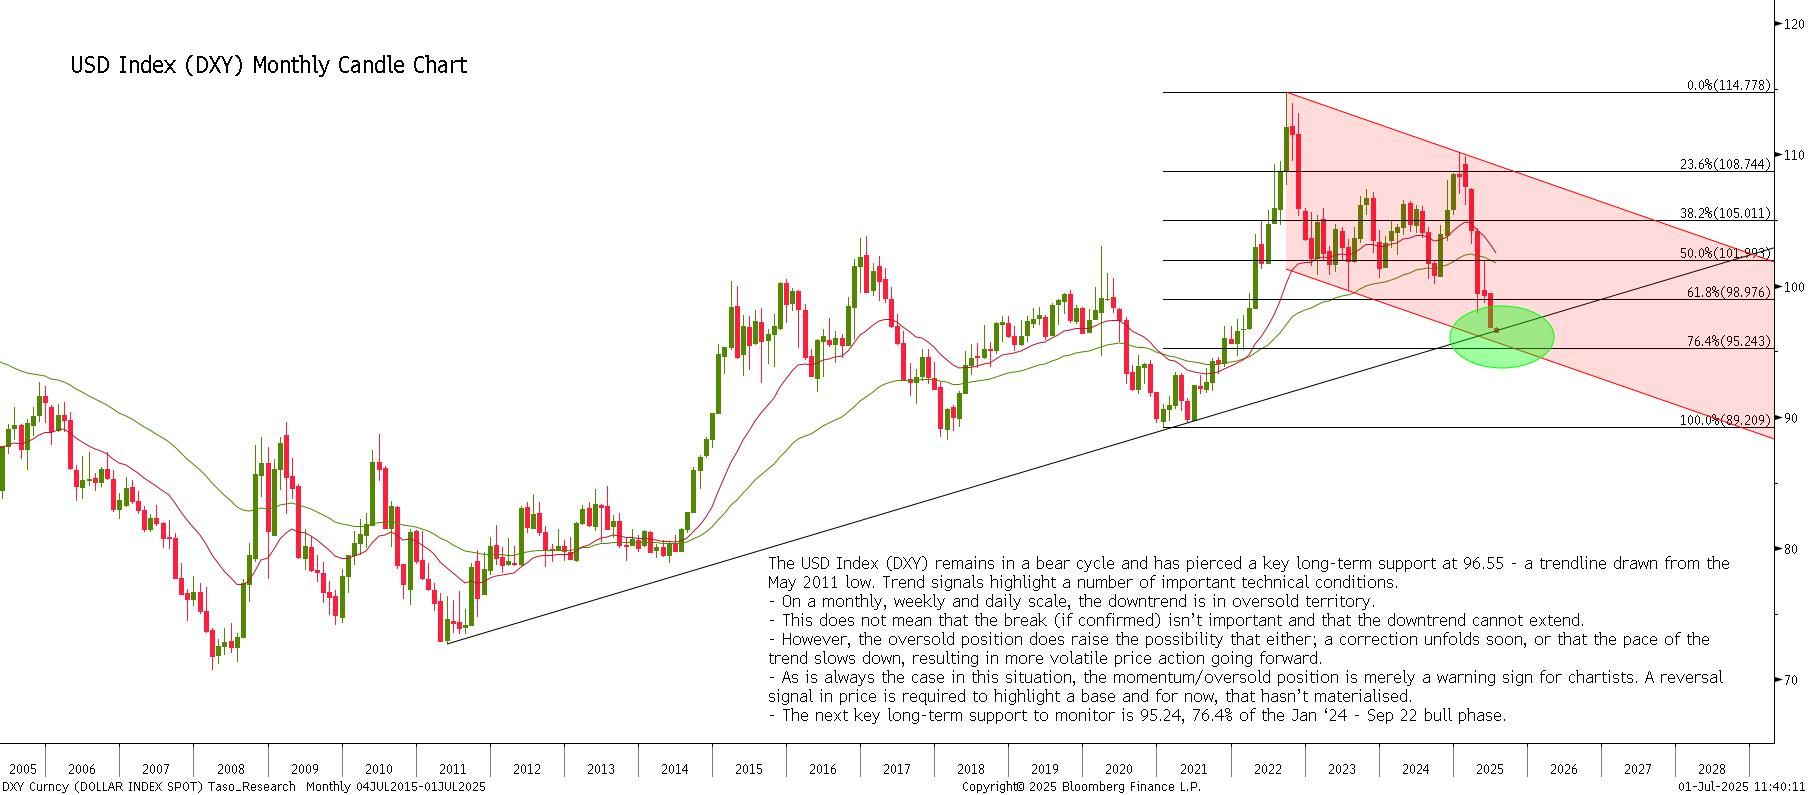
The USD Index (DXY) remains in a bear cycle and has pierced a key long-term support at 96.55 - a trendline drawn from the May 2011 low. Trend signals highlight a number of important technical conditions.
- On a monthly, weekly and daily scale, the downtrend is in oversold territory.
- This does not mean that a trendline break (if confirmed) isn’t important and that the downtrend cannot extend.
- However, the oversold position does raise the possibility that either; a correction unfolds soon, or that the pace of the trend slows down, resulting in more volatile price action going forward.
- As is always the case in this situation, the momentum/oversold position is merely a warning sign for chartists. A reversal signal in price is required to highlight a base and for now, that hasn’t materialised.
- The next key long-term support to monitor is 95.24, 76.4% of the Jan ‘24 - Sep 22 bull phase.
