US 10YR FUTURE TECHS: (U5) Bull Cycle Extends
- RES 4: 114-14 High Apr 7 and key resistance
- RES 3: 113-07 76.4% retracement of the Apr 7 - 11 bear leg
- RES 2: 112-23 High May 1 and key resistance
- RES 1: 12-04+ High May 2
- PRICE: 111-30+ @ 14;49 BST Jun 27
- SUP 1: 110-24 50-day EMA
- SUP 2: 110-10+/109-28 Low Jun 16 / Low Jun 6 / 11
- SUP 3: 109-12+ Low May 22 and the bear trigger
- SUP 4: 109-09+ Low Apr 11 and key support
Treasury futures are trading higher again, today. Price has cleared resistance at 111-14+, the Jun 5 high and 61.8% of the May 1 - 22 downleg. The clear break of this hurdle strengthens a bullish cycle. Note too that today’s gains have delivered a print above 111-30, 76.4% of May 1-22 downleg. A clear break of this level would strengthen current conditions. Initial pivot support to watch lies at 110-24, the 50-day EMA.
Want to read more?
Find more articles and bullets on these widgets:
Historical bullets
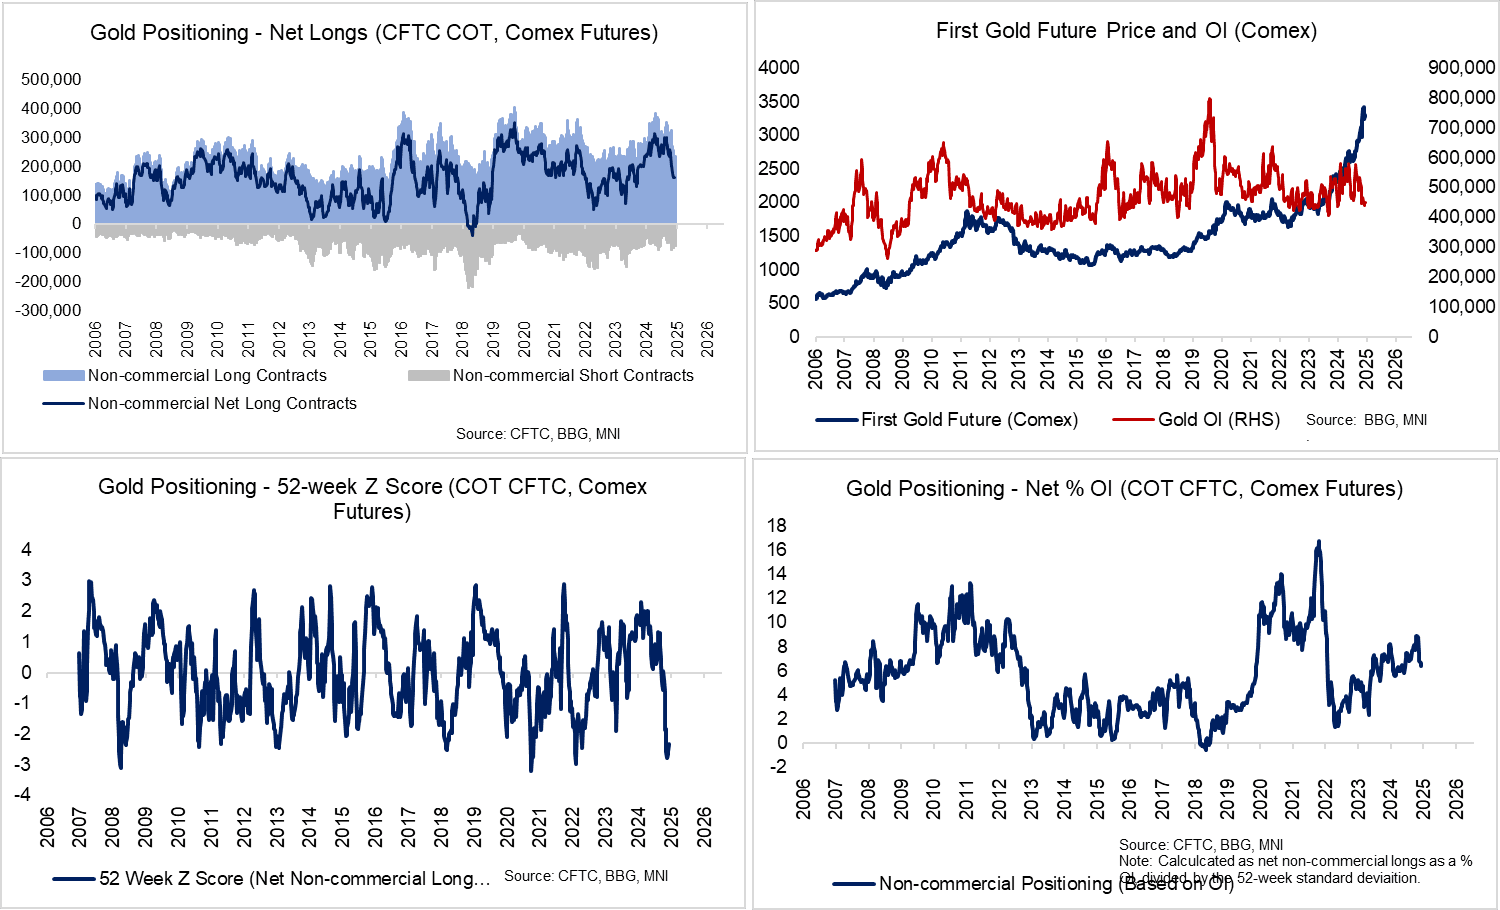
GOLD: 20-day EMA and USD Pullback Lends Gold Support; Technical Outlook Bullish
Gold has fallen 1.4% to ~$3,300/oz, but a move away from highs for the broader USD index and support from the 20-day EMA has contained downside intraday. Technically, the recovery from the May 15 low has signalled an end to the corrective phase that started on April 22. Medium-term trend signals are unchanged and remain bullish, with initial resistance at $3365.9 (May 23 high). This level shields the May 7 high at $3435.6.
- Even though peak US effective tariff rates appear to be in the rear-view, US President Trump’s U-turn on 50% EU tariffs last weekend indicates that trade policy uncertainty remains acute. Taken alongside ongoing US fiscal concerns, the case for gold in portfolios and as central bank reserves remains strong.
- Following the aformentioned corrective phase between Apr 22- May 15, the positioning backdrop is also cleaner for those looking to re-enter gold longs.
- TD Securities note that “CTAs will buy gold in any scenario over the coming week. We expect that systematic trend followers will grow their position size by a third by this time next week (or +10% of max size), benefiting from vol-control and rising signal strength. This will mark the first notable buying impulse in gold futures following large scale liquidations associated with macro fund divestment in the weeks surrounding Liberation day”.
- Looking at the sources of gold demand, TD write that “only retail ETF holders are vulnerable, both in the West and the East. A shift in strategic asset allocations has contributed a significant portion of recent global ETF inflows, suggesting that persistent central bank buying activity should be sufficient to offset such outflows from retail holders”.
- According to World Gold Council data, there was $3.4bln of outflows from Gold ETFs between May 5 and May 23 (31.4 tonnes). Monthly data for April covering Central Bank flows should be released around the start of June.
EQUITY TECHS: E-MINI S&P: (M5) Support Remains Intact
- RES 4: 6080.75 High Feb 26
- RES 3: 6057.00 High Mar 3
- RES 2: 6000.00 Round number resistance
- RES 1: 5993.50 High May 20 and the bull trigger
- PRICE: 5882.50 @ 14:32 BST May 27
- SUP 1: 5756.50/5719.58 Low May 23 / 50-day EMA and key support
- SUP 2: 5596.00 Low May 7
- SUP 3: 5455.50 Low Apr 30
- SUP 4: 5355.25 Low Apr 24
A bullish trend condition in S&P E-Minis remains intact and the latest pullback is considered corrective. Last Friday’s sell-off resulted in a print below the 20-day EMA, at 5779.53. A key support lies at 5719.58, the 50-day EMA. A clear break of this average is required to highlight a stronger reversal and signal scope for a deeper retracement. Sights are on the bull trigger at 5993.50, the May 20 high.
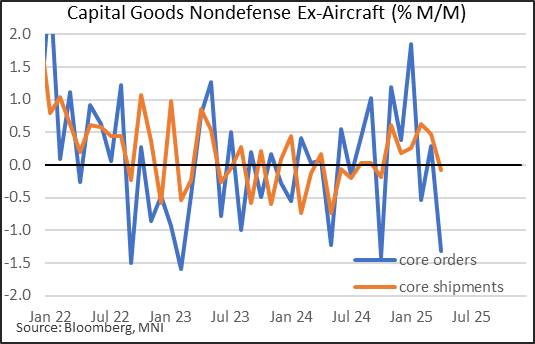
US DATA: Core Durable Goods Giving Back Q1 Gains, But Sharp Q2 Dropoff Not Clear
April's Advance Report on Durable Goods Manufacturers' Shipments Inventories and Orders was broadly weak, with headline durable goods orders contracting sharply (-6.3% M/M) as expected in a reversal of March's strong gains (+7.6%), but with capital goods orders coming in on the weak side.
- Ex-transport orders for durables rose 0.2% (-0.2% prior), illustrating the high sensitivity in the headline figure to aircraft orders (Nondefense aircraft and parts fell 51.5% M/M after +158.5% in March), while the closely-watched core (nondefense, ex-aircraft) capital goods orders fell 1.3% (+0.3% prior).
- This is a slightly more complex read-through for results vs analyst consensus on monthly growth - the Census Bureau in mid-May re-benchmarked all of the data going back to 2012, meaning that March's "final" figures were revised (eg durable goods orders looked like a substantial downward revision to 7.6% vs 9.2% in March's report, but this was only up 0.1pp from 7.5% in the latest benchmark release for March).
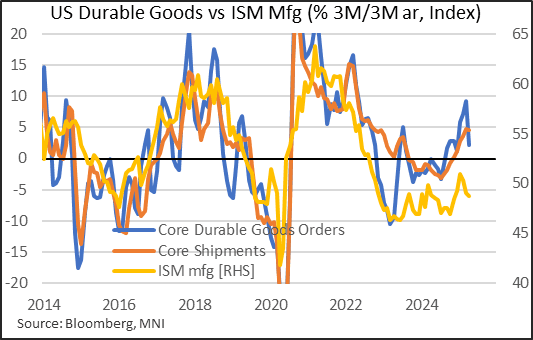
- But the broader readthrough is one of weakness. the fall in core capital durable goods was the biggest in 6 months, and the 2nd most in 26 months. This brought down momentum, with the 3M/3M annualized rate at 2.2% in April, after 9.2% in March; on a Y/Y NSA basis, core capital goods orders are up just 0.6%. Core shipments fell 0.1% for the first decline in 6 months, and while still running at a 4.6% quarterly clip, this is merely lagging the strong orders in earlier months.
- Of course, tariffs (and front-running thereof) have to be mentioned as a possible catalyst for the pullback - for instance, motor vehicles and parts orders fell 2.9% M/M after strong growth in both March and February. And the orders numbers mirror the ISM manufacturing survey showing new orders have contracted for three consecutive months amid a headline index below 50.0 in the last two (Mar-April), with tariffs a key theme.
- But it's not so clear-cut looking at the underlying durables data: for example, computers and electronic products orders grew in April after contracting in March, while machinery and fabricated metal products orders also accelerated, suggesting that business fixed investment isn't showing clear evidence of falling off a cliff in Q2.
- Going forward it looks as though Q1 was indeed illusory in terms of underlying upside momentum for equipment investment, but it's not yet clear whether Q2 activity - while clearly slowing - will see quite as dramatic a drop-off as suggested by sentiment indicators.