US: Trump To Declare A National Housing Emergency
President Trump is potentially about to declare a national housing emergency, why is this ? Below are some excerpts related to the overnight announcement:
- US (MNI): Trump May Declare National Housing Emergency In Fall - Bessent. US Treasury Secretary Scott Bessent told the Washington Examiner that President Donald Trump may declare a 'national housing emergency' this fall to address rising house prices. The Washington Examiner notes that there hasn't been a national housing emergency declared since the 2008 recession.
- John Wake on X: "Homebuilder inventory hits 2009 levels". https://t.co/FIEJgJSKnx. See Graph Below.
- Bob Elliott on X: ”Low activity and falling prices suggests the housing market is cracking at this point.”
- EndGame Macro on X: “We’re now back to the highest level of completed but unsold homes since 2009. Historically, when completed inventory rises this sharply, it’s a sign that demand is failing to keep pace. Builders don’t like to sit on finished product because every unsold house ties up capital and financing costs. The last time we saw this dynamic in 2006–2009, the oversupply collided with weakening demand and set up a multi year price correction.”
- “Based on historical precedent, inventories at this level almost always mark the start of builders offering discounts, incentives, and eventually price cuts to clear supply. In 2009, unsold inventory peaked just before the steepest leg down in home values. Today isn’t identical, credit quality is stronger, but debt loads, economic strain, and demographic headwinds point to the same pressure.”
- “Going forward, the most likely scenario is a correction, not a rebound. Housing cycles take years to play out, and this chart suggests we’re entering the phase where supply begins to overwhelm demand.” See Graph below.
- Thomas Thornton on X: “Either prices are too high or rates are too high. Lower rates artificially and will see higher home prices. You want both lower at the same time, let a recession happen.”
Fig 1: Number of Unsold Completed Homes For Sale
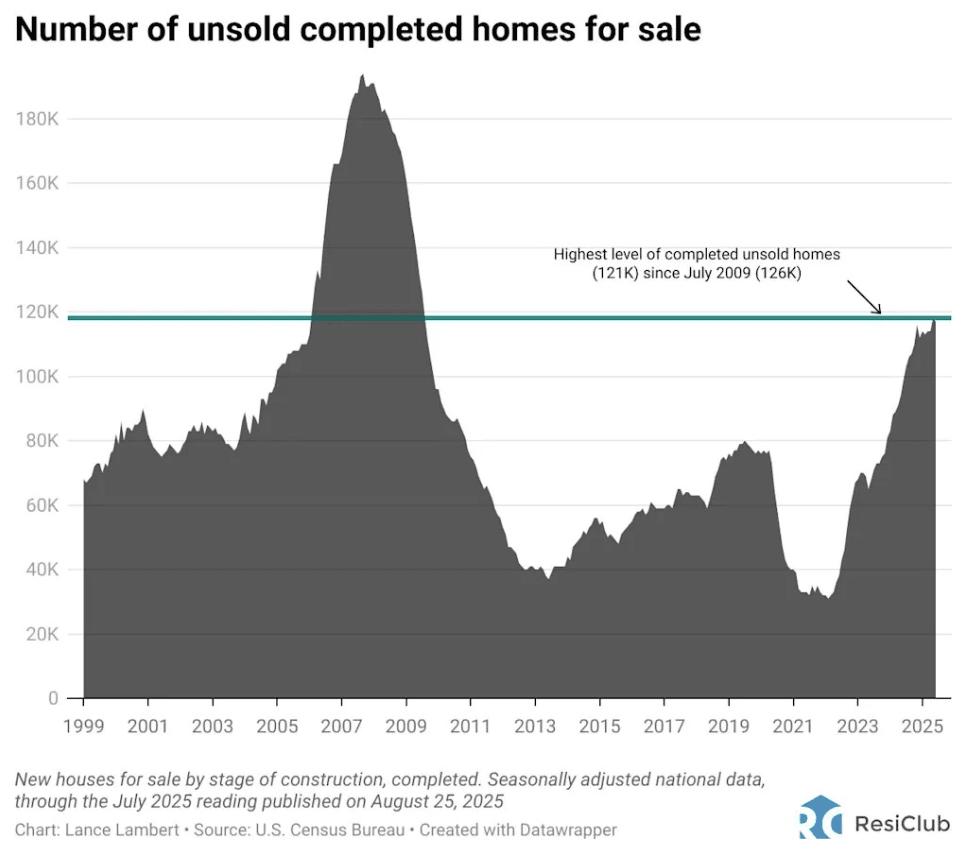
Source: MNI - Market News/@JohnWake
Want to read more?
Find more articles and bullets on these widgets:
Historical bullets
JGB TECHS: (U5) NFP Tips Prices Sharply Higher
- RES 3: 147.74 - High Jan 15 and bull trigger (cont)
- RES 2: 146.53 - High Aug 6
- RES 1: 141.48/142.95 - High May 2 / High Apr 7
- PRICE: 138.63 @ 17:23 GMT Aug 1
- SUP 1: 137.32 - Low Jul 25
- SUP 2: 136.57 - 1.382 proj of the Jan 28 - Feb 20 - Feb 26 bear leg
- SUP 3: 134.89 - 2.000 proj of the Jan 28 - Feb 20 - Feb 26 bear leg
JGBs rallied sharply alongside global bond markets Friday, piercing mid-week resistance in the process. The first important resistance to watch is 141.48, the May 2 high. A break of this level would be viewed as an early bullish signal. A return lower would signal scope for an extension towards 136.57, a Fibonacci projection.
USDCAD TECHS: Slips Sharply on USD Downdraft
- RES 4: 1.4111 Apr 10
- RES 3: 1.4019 38.2% retracement of the Feb 3 - Jun 16 bear leg
- RES 2: 1.3920 High May 21
- RES 1: 1.3879 High Aug 1
- PRICE: 1.3794 @ 17:42 BST Aug 1
- SUP 1: 1.3716/3557 20-day EMA / Low Jul 03
- SUP 2: 1.3540 Low Jun 16 and the bear trigger
- SUP 3: 1.3503 1.618 proj of the Feb 3 - 14 - Mar 4 price swing
- SUP 4: 1.3473 Low Oct 2 2024
A short-term bullish corrective phase in USDCAD remains in play despite sharp weakness Friday. On the recent run higher, price traded through the 50-day EMA at 1.3739 and this has been followed by a break of resistance at 1.3798, the Jun 23 high. Clearance of 1.3798 represents an important short-term bullish development, signalling scope for a stronger recovery. Sights are on 1.3920 next, the May 21 high. On the downside, initial firm support to watch lies at 1.3716, the 20-day EMA.
MACRO ANALYSIS: MNI US Macro Weekly: Poor Payrolls Trumps Patient Powell
- We have published and e-mailed to subscribers the MNI US Macro Weekly offering succinct MNI analysis across the range of macro developments over the past week.
- Please find the full report here.
Executive Summary
- The second half of the week has seen some significant moves in markets from first a patient Fed Chair Powell not giving a nod to a September rate cut before a weak payrolls report with huge downward revisions materially altered recent trends.
- Nonfarm payrolls growth underwhelmed at 73k in July but the major headline was the -258k two-month downward revision, of which -139k came from the private sector and -119k from the public sector. Outside of April 2020, that’s the largest two-month downward revision in at least forty-five years.
- We caution though that whilst jobs growth has soured sharply, it’s doing so along with a significant slowing in labor supply under immigration curbs.
- As such, the unemployment rate may have technically ticked up to a new cycle high of 4.248% (above 4.244% in May) but it continues to roughly plateau in the 4.0-4.25% range seen since last July. The median FOMC forecast from the June SEP had the unemployment rate increasing to an average 4.5% in 4Q25 as part of forecast with two rate cuts in 2025 so further deterioration would be expected.
- A note on the latest initial jobless claims data, which are back at 2019 averages, a period when the unemployment rate averaged 3.7%.
- The weak report prompted an extraordinary response from President Trump, directing his team to fire BLS Commissioner Erika McEntarfer. It’s a broadening out of criticism beyond the Fed’s Powell and its Board.
- Speaking after payrolls, Atlanta Fed’s Bostic (in a non-voting role this year) said he hasn’t changed his view that there should be just one rate cut this year.
- Elsewhere in a major week for data, core PCE inflation exceeded latest Fed tracking in June at 2.8% Y/Y, whilst away from any tariff impact, market-based services inflation printed 3.3% Y/Y. Various inflation metrics showed a continued stabilization at above 2% target rates.
- The Q2 GDP advance release meanwhile beat analyst expectations with 3.0% annualized although it was close to Atlanta Fed GDPNow expectations. PDFP moderated further to 1.2% annualized for its weakest since 4Q22 although could have been worse.
- As a precursor to next week’s ISM Services report, the Manufacturing counterpart was weak across the board in July. Prices paid pulled back from recent highs, new orders chalked up a sixth consecutive month firmly in contraction territory and the employment index fell to its lowest since mid-2020.
- Yields have tumbled after the weak payrolls report. A September cut is mostly priced now vs 50/50 before the release, with a cumulative 59bp by year-end and five cuts in total from current levels.