USDJPY TECHS: Trend Signals Remain Bullish
- RES 4: 155.89 High Feb 3
- RES 3: 155.53 2.00% retracement of the Jan 10 - Apr 22 bear leg
- RES 2: 154.80 High Feb 12
- RES 1: 154.48 High Nov 4
- PRICE: 153.44 @ 07:15 GMT Nov 7
- SUP 1: 152.46 20-day EMA
- SUP 2: 151.54 Low Oct 29
- SUP 3: 150.66 50-day EMA
- SUP 4: 149.38 Low Oct 17
The trend structure in USDJPY remains bullish and the latest shallow pullback appears corrective. Moving average studies are in a bull-mode position, highlighting a dominant uptrend. A resumption of the uptrend would pave the way for a climb towards 154.80, the Feb 12 high. First important support to watch lies at 152.46, the 20-day EMA. A break of this level would signal scope for a deeper corrective retracement.
Want to read more?
Find more articles and bullets on these widgets:
Historical bullets
USDCAD TECHS: Bullish Wave
- RES 4: 1.4111 High Apr 10
- RES 3: 1.4083 3.0% Upper Bollinger Band
- RES 2: 1.4019 38.2% retracement of the Feb 3 - Jun 16 bear leg
- RES 1: 1.3982 200-dma
- PRICE: 1.3964 @ 08:15 BST Oct 8
- SUP 1: 1.3889/3839 20- and 50-day EMA values
- SUP 2: 1.3727 Low Aug 29 and a bear trigger
- SUP 3: 1.3689 Low Jul 28
- SUP 4: 1.3637 Low Jul 25
USDCAD continues to trade just ahead of its recent highs. A bull cycle remains intact. The breach of 1.3959, the Sep 26 high, reinforces current conditions. The move higher maintains the bullish price sequence of higher highs and higher lows. Note too that moving average studies are in a bull-mode position, highlighting a dominant uptrend. Sights are on 1.4019, a Fibonacci retracement point. On the downside, first key support lies at 1.3834, the 50-day EMA.
EUROSTOXX50 TECHS: (Z5) Trend Needle Points North
- RES 4: 5777.41 1.382 proj of the Aug 1 - 22 - Sep 2 price swing
- RES 3: 5727.18 1.236 proj of the Aug 1 - 22 - Sep 2 price swing
- RES 2: 5700.00 Round number resistance
- RES 1: 5689.00 High Oct 2
- PRICE: 5619.00 @ 07:55 BST Oct 8
- SUP 1: 5615.00 Intraday low
- SUP 2: 5527.10 20-day EMA
- SUP 3: 5455.98 50-day EMA
- SUP 4: 5366.00 Low Sep 17
Eurostoxx 50 futures remain in a bull-mode condition and short-term weakness is considered corrective. The recent breach of key resistance at 5525.00, the Aug 22 high, confirms a resumption of the uptrend. Sights are on the 5700.00 handle next, with potential for a test of 5727.18 further out, a Fibonacci projection. MA studies are in a bull-mode position too, highlighting a dominant uptrend. Initial firm support is 5527.10, the 20-day EMA.
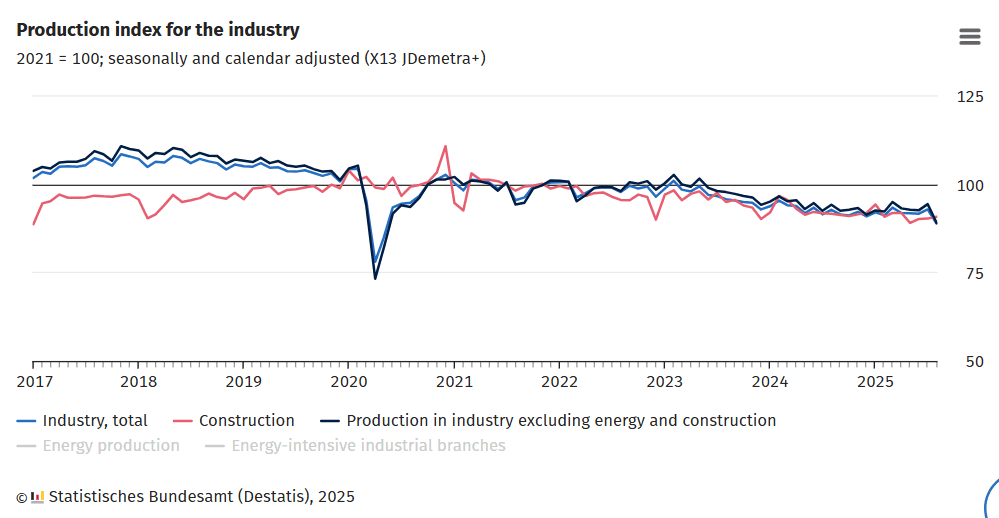
GERMAN DATA: August Manufacturing Sees Broad-Based Drop to Cycle Lows
- Industrial production in August was much weaker than expectations (-4.3% M/M vs -0.9% cons). Destatis mentions some one-offs for the particularly weak print but the drop to cycle lows remains. On a 3m/3m comparison, IP printed -1.3%.
- "In August 2025, production in industry excluding energy and construction was down 5.6% from July 2025 after seasonal and calendar adjustment. Within industry, decreases were reported in all three major groups". See chart below for an index comparison.
- "The negative development of production was particularly attributable to the sharp decrease seen in the automotive industry, Germany's largest industrial branch (-18.5% on the previous month). The marked decrease may be explained, at least in part, by the combination of annual plant closures for holidays and production changeovers. The development of production in the manufacture of machinery and equipment (-6.2%) continued to have a negative impact on the overall result, following the increase of 9.2% registered in July 2025 [eg base effects at play here]. The drop in output witnessed in the pharmaceutical industry (-10.3%) and in the manufacture of computer, electronic and optical products (-6.1%) also had a negative effect.", Destatis comments on drivers.