US DATA: Trade Deficit Widens As Industrial, Capital Goods Imports Pick Up
Aug-29 17:11
The goods trade deficit widened to an unexpected extent in July's advance report, to $103.6B ($90.2B expected, $84.9B prior). That was the biggest deficit since March's record tariff-induced shortfall, and notably up from a monthly average $89.0B over Q2.
- The driver was imports, which jumped 7.1% M/M for the biggest percentage increase since January; exports were relatively stable with not much to catch the eye (at -0.1% M/M, they declined for a 3rd consecutive month and are now at a 6-month low).
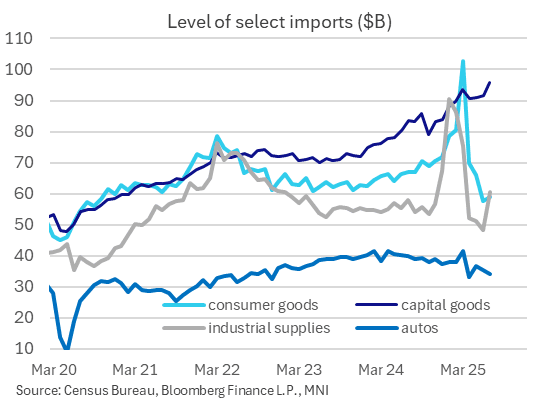
- Breaking down the $18.6B jump in imports (to $281.5B, a 4-month high), around two-thirds of the rise came from the industrial supplies & materials category, which picked up to $60.7B from $48.4B prior for a 4-month high. This 25% M/M rise is reminiscent of increases earlier in the year that were in large part driven by (monetary) gold imports. That may be partly the case again in July looking at a rise in Comex gold inventories, but there may also be other elements at play including copper imports surging amid tariff concerns. We will know more details after next week's full trade release.
- Additionally, capital goods imports rose over $4B to a new nominal record ($95.9B), accounting for most of the rest of the import increase, with the 4.8% M/M rise the fastest since January. Outside of that, consumer goods imports notably ticked up 2.1% for the first increase since March, and autos imports continue to sag.
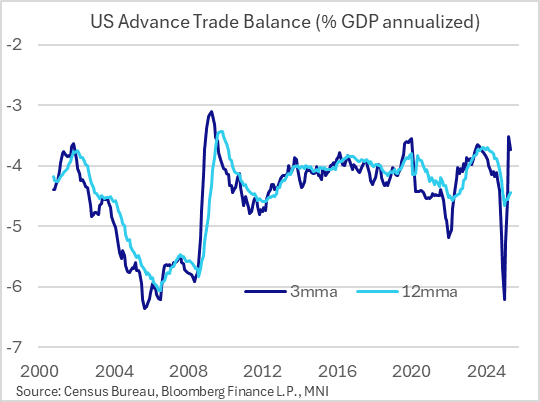
- This leaves the 3-month moving average trade balance hovering in the high 3% of GDP area, around where it was for most of 2023-2024 before rising above 4% in 2024 and bursting above 6% in Q1 amid tariff front-running.
- It's running at around 4.4% of GDP a 12-month basis, again elevated from the high 3% levels in 2023-24 but down from the 4.7% peak in March.
Want to read more?
Find more articles and bullets on these widgets:
Historical bullets
SOFR OPTIONS: Midday Roundup: Two-Way Puts $ Vol Flow
Jul-30 17:04
Underlying futures still weaker but off this morning's lows, paring shorts ahead of the FOMC rate annc at the top of the hour. Projected rate cut pricing has cooled vs. early/pre-data (*) levels: Jul'25 at -0.8bp, Sep'25 at -15.2bp (-16.9bp), Oct'25 at -27.1bp (-29.1bp), Dec'25 at -44bp (-46.6bp). Year end projection well off early July level of appr -65.0bp.
- -6,000 0QU5 96.37 puts, 2.5 vs. 96.685/0.12%
- -3,000 SFRH6 96.25 straddles, 44.75
- +5,000 SFRZ5 96.62/97.75 call spds 2.75
- +2,500 SFRU5 95.87 straddles 13.5 over 96.12 calls
- +10,000 SFRH6 95.68 puts, 2.5 vs. 96.275/0.10%
OPTIONS: Sonia Leans To Upside, Euribor To Downside Wednesday
Jul-30 16:52
Wednesday's Europe rates/bond options flow included:
- ERZ5 98.12/98.06/98.00 put fly paper paid 0.5 (vs. 98.13) on 5K
- ERZ5 97.87 puts paper paid 1.0 on 18K
- SFIQ5 96.15/96.20cs, bought for 0.6 in 5k
LOOK AHEAD: Thursday Data Calendar: Weekly Claims, Core PCE, Chicago PMI
Jul-30 16:37
- US Data/Speaker Calendar (prior, estimate)
- 07/31 0730 Challenger Job Cuts YoY (-1.6%, --)
- 07/31 0830 Initial Jobless Claims (217k, 223k)
- 07/31 0830 Continuing Claims (1.955M, 1.953M)
- 07/31 0830 Personal Income (-0.4%, 0.2%), Spending (-0.1%, 0.4%)
- 07/31 0830 Real Personal Spending (-0.3%, 0.1%)
- 07/31 0830 PCE Price Index MoM (0.1%, 0.3%), YoY (2.3%, 2.5%)
- 07/31 0830 Core PCE Price Index MoM (0.2%, 0.3%), YoY (2.7%, 2.7%)
- 07/31 0830 Employment Cost Index (0.9%, 0.8%)
- 07/31 0945 MNI Chicago PMI (40.4, 42.0)
- 07/31 1130 US Tsy $95B 4W & $85B 8W bill auctions
- Source: Bloomberg Finance L.P. / MNI
Trending Top
Jan-30 21:43
Jan-30 21:11