US DATA: Trade Deficit Edging Wider With Tariffs In View
Dec-27 14:09
November's advance trade deficit was a little wider than October's, with the $102.9B shortfall above $98.3B prior ( and $101.2B expected).
- On a year-on-year basis, exports have risen 6% with imports up 7% (non-seasonally adjusted), with the relatively stronger import growth (on a much higher base) leaving the seasonally-adjusted deficit up $14B. A rough estimate puts the 3-month moving average deficit at 4.2% of GDP, which would be the highest seen since August 2022. That squares with an apparent rebound in goods demand and a bottoming of core goods prices, per recent data releases.
- When incorporating positive services net exports, the deficit is closer to 3% of GDP, but we only get that data in the final trade release. October's trade deficit (goods and services) registered $73.8B vs $83.8B in September, about $1B smaller than expected, with a 4% drop in imports outpacing a 1.6% fall in exports. September's nominal trade deficit was the largest ever, so a snap-back was anticipated.
- Within October's import pullback, as we noted after the advance goods trade release last month, the most notable line item was a sharp fall in capital goods: the 8.7% M/M drop (to $78,7B, ex-automotive) was easily the sharpest since the pandemic. That's slightly jarring given that strong capital goods imports appeared to be a signal that US capital investment continued to be robust through Q3, corroborated in part by a stabilization in domestic durable goods orders. As such one positive in November's advance data was a re-stabilization in capital goods imports (+4.3% to $82.1B).
- Of course the big question heading into 2025 is what degree tariffs will be imposed, and how it will impact the trade data. It's plausible we could see the deficit widen in the short run if importers attempt to front-run the imposition of tariffs: there is some evidence for example that Chinese exports picked up sharply in November, with anecdotes of US corporates adjusting their import strategies (see the latest ISM Manufacturing report). In any case the trend since late-2023 has been toward a wider deficit, largely capital-goods driven.

Want to read more?
Find more articles and bullets on these widgets:
Historical bullets
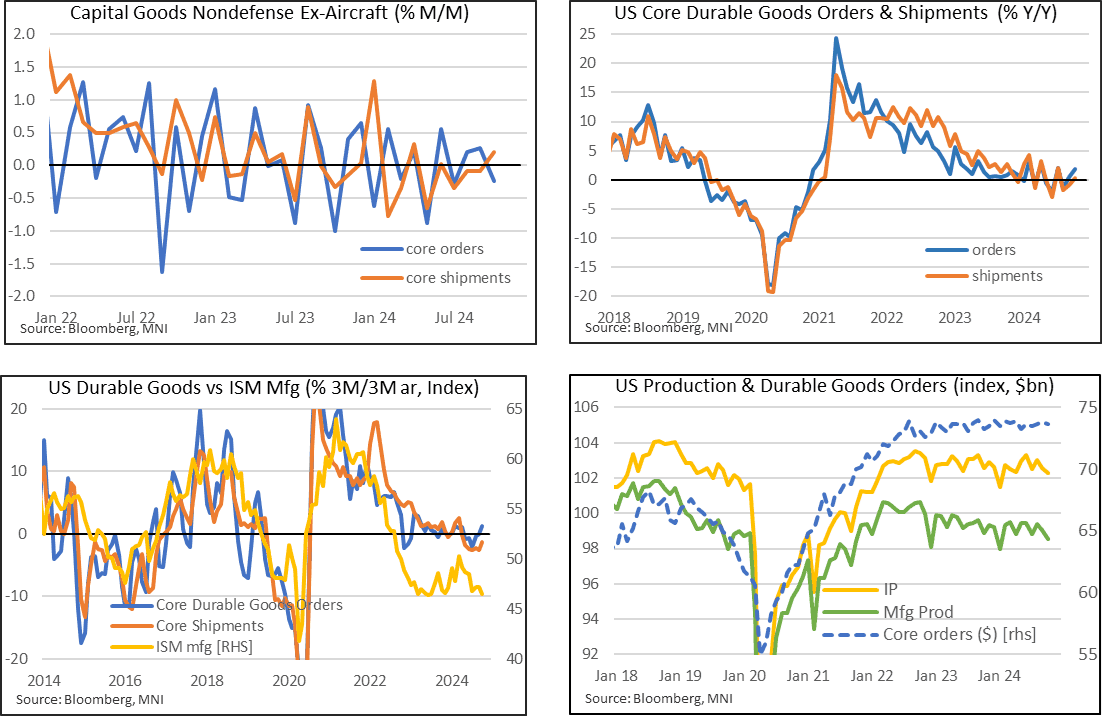
US DATA: Core Durable Goods Orders Maintain Underwhelming Trend
Nov-27 14:05
- Durable goods orders were overall as expected in preliminary October data, with the softer than expected 0.2% M/M (cons 0.5) in Oct offset by an upward revised -0.4% (initial -0.7%) in Sep.
- Core orders offered a more clearcut downward surprise though, with -0.2% M/M (cons 0.1) in Oct after a downward revised 0.3% (initial 0.7%) in Sep.
- Core shipments were more closely in line with expectations, rising 0.2% M/M (cons 0.1) after an unrevised -0.1% M/M.
- Despite the relative miss, core durable goods orders continue to outperform shipments, rising 1.2% annualized on a 3m/3m basis vs -1.2% for shipments.
- It suggests some upside for realized production in the months ahead although the trend remains subdued considering these are nominal series – see the broadly sideways trend in the bottom right chart below.
US: SFR Mid curve trades again
Nov-27 14:04
3QH5 97.25/97.50cs, sold again at 1 in 5k, 10k total.
STIR: No Movement In Fed Pricing On Data
Nov-27 13:53
No net movement in Fed pricing on the 08:30 NY data.
- Fed funds futures show 17bp of easing for next month, 22.5bp of cuts through January, 35.5bp of cuts through March, 54bp of cuts through June and 77bp of cuts through December ’25.
- The 08:30 data (detailed elsewhere) did not provide enough conviction to drive a move ahead of the Thanksgiving holiday, with focus now moving to the MNI Chicago PMI and monthly PCE data suite.
Trending Top
May-22 16:54