EM ASIA CREDIT: The Lao People's Democratic Republic: USD mandate FV estimate
(Caa3/CCC+pos/CCC+)
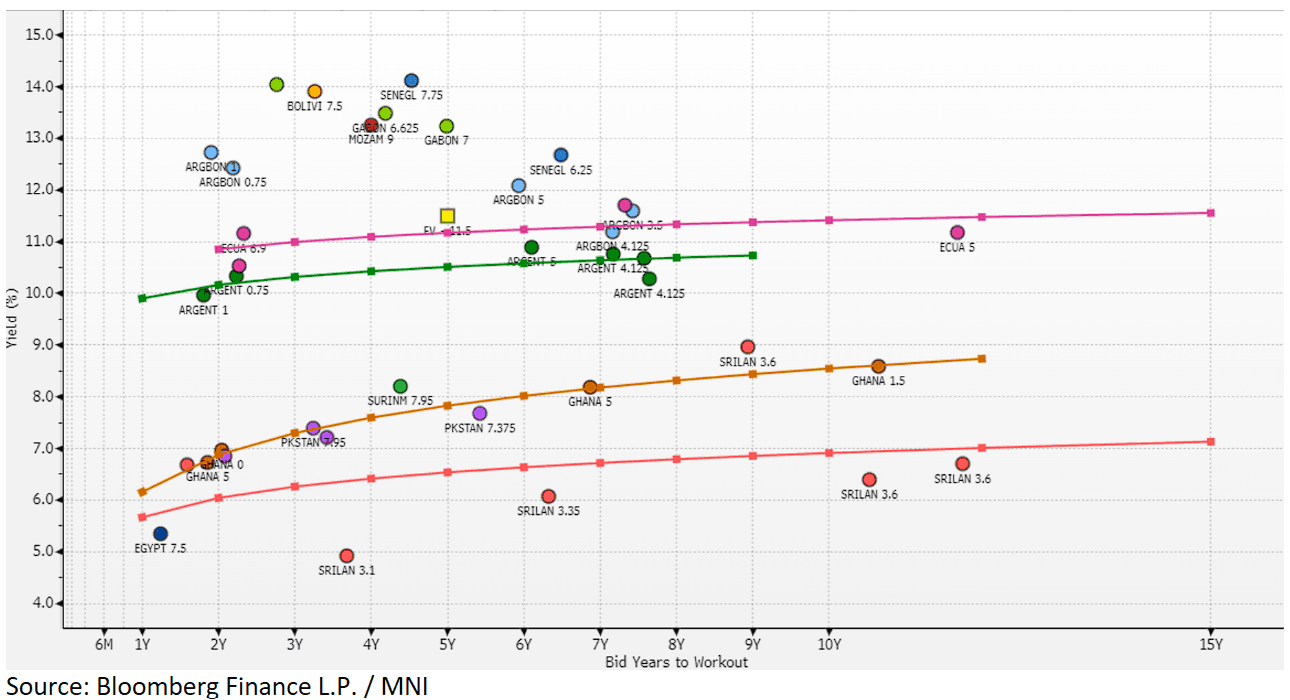
Mandate: USD 5Y, possible benchmark size.
Fair Value estimate: 11.5-12% area.
The Lao People's Democratic Republic, rated high CCC, is a landlocked country in Southeast Asia bordered by China, Vietnam, Cambodia, Thailand, and Myanmar. Its economy is primarily driven by the services sector, which accounts for approximately 53% of GDP, followed by industry at 31%, and agriculture at 16%. Key industries include mining, particularly copper, and hydroelectric power.
In 2024, the World Bank reported economic growth of 4.1%, largely supported by expansion in services, electricity generation, mining, agriculture, and manufacturing. Tourism also grew significantly, with a 21% increase in foreign visitors and a rise in domestic travel. Thailand and China continue to be the largest export destinations.
Public debt remains a challenge, estimated at around 96% of GDP in 2024, down from 116% in 2023. While principal repayments to Chinese creditors have been deferred, financing needs remain significant at approximately 4.4% of GDP according to the World Bank.
Laos was added to the Financial Action Task Force’s (FATF) grey list in early 2025 due to weaknesses in its anti-money laundering, counter-terrorist financing, and proliferation financing frameworks, potentially affecting investor interest in new bond issuances.
S&P’s recent commentary noted the CCC+ rating, with a positive outlook, reflects improving macroeconomic conditions, a near-balanced fiscal position, a current account surplus, and rising foreign exchange reserves.
For fair value of the new deal, we consider Laos’s high CCC rating alongside similarly rated emerging market sovereign issuers such as Argentina (NR/CCC/NR), Ghana (Caa1/CCC+/B-), Ecuador (NR/B-/CCC+), and Mozambique (Caa2/NR/NR).
Mozambique, with a debt-to-GDP ratio around 97%, is a close comparable, while Ecuador’s similar rating and status as a small, export-reliant open economy also provide useful benchmarks. Taking Laos's FATF grey listing into account, we estimate a fair value range in the 11.5–12.0% area, positioning it between Mozambique and Ecuador. We may revise this as further details emerge.
Want to read more?
Find more articles and bullets on these widgets:
Historical bullets
USDCAD TECHS: Fresh Cycle High
- RES 4: 1.4111 High Apr 10
- RES 3: 1.4045 3.0% Upper Bollinger Band
- RES 2: 1.4019 38.2% retracement of the Feb 3 - Jun 16 bear leg
- RES 1: 1.3989 200-dma
- PRICE: 1.3953 @ 16:02 BST Oct 3
- SUP 1: 1.3897/3825 Low Sep 30 / 50-day EMA
- SUP 2: 1.3727 Low Aug 29 and a bear trigger
- SUP 3: 1.3689 Low Jul 28
- SUP 4: 1.3637 Low Jul 25
A bull cycle in USDCAD remains intact and yesterday’s break above the late September’s high, firms the bullish theme. This move higher also maintains the bullish price sequence of higher highs and higher lows. Note too that moving average studies are in a bull-mode position, highlighting a dominant uptrend. Sights are on 1.4019, a Fibonacci retracement point. On the downside, first key support lies at 1.3825, the 50-day EMA.
AUDUSD TECHS: Support Remains Intact For Now
- RES 4: 0.6763 1.382 proj of the Jun 23 - Jul 24 - Aug 21 price swing
- RES 3: 0.6726 1.236 proj of the Jun 23 - Jul 24 - Aug 21 price swing
- RES 2: 0.6660/6707 High Sep 18 / 17 and key resistance
- RES 1: 0.6629 High Sep 30 & Oct 01
- PRICE: 0.6603 @ 16:01 BST Oct 3
- SUP 1: 0.6527/21 61.8% of the Aug 21 - Sep 17 bull leg / Low Sep 26
- SUP 2: 0.6484 76.4% retracement of the Aug 21 - Sep 17 bull leg
- SUP 3: 0.6463/6415 Low Aug 27 / Low Aug 21 / 22 and a bear trigger
- SUP 4: 0.6373 Low Jun 23
The AUDUSD uptrend remains intact and recent weakness appears to have been a correction. Support to watch lies at the 50-day EMA, at 0.6558. A clear break of this average would signal scope for a deeper retracement and expose 0.6527 once again, a Fibonacci retracement. For bulls, a stronger reversal higher would refocus attention on 0.6707, the Sep 17 high. Initial resistance to watch is 0.6629, the Sep 30 and Oct 1 high.
US TSYS/SUPPLY: September's Coupon Auctions Were Generally Solid (2/2)
September’s coupon auctions were generally solid, with three lines trading through, two coming out on the screws and two tailing slightly.
- Looking through the lens of MNI’s Relative Strength Indicator (RSI), five lines saw positive readings while two saw negative readings.
- The 3-year sale was the strongest auction of the month according to MNI’s RSI. The 3-year line traded through 0.7bps, the largest stop through in seven months. Meanwhile, the primary dealer take-up was just 8.4%, the lowest on record (data going back to 2003).
- The weakest sale of the month was the last – the 7-year line. This line saw the second consecutive 0.5bp tail, with the 12.0% primary dealer take-up above August’s 9.8% and July’s record low 4.1%.
September Auction Review:
- 2Y Note on-the-screws: 3.571% vs. 3.571% WI.
- 2Y FRN: 0.200% high margin vs. 0.195% prior
- 3Y Note trade-through: 3.485% vs. 3.492% WI.
- 5Y Note tail: 3.710% vs 3.709% WI.
- 7Y Note tail: 3.953% vs. 3.948% WI.
- 10Y Note trade-through: 4.033% vs. 4.047% WI.
- 10Y TIPS: 1.734% high yield vs. 1.985% prior
- 20Y Bond trade-through: 4.613% vs 4.615% WI.
- 30Y Bond on-the-screws: 4.651% vs. 4.651% WI.
