ASIA STOCKS: Tech Weighed By China Curbs, HSTECH Back Close To 20-day EMA
Most Asia Pac markets are lower, with tech headwinds weighing. This reflects broader global moves (with major indices down in cash trade on Thursday) but also concerns around China export controls in the tech space. Given how bullish sentiment has been recently, markets may be needing fresh catalysts to continue the recent rally at its heady pace. US futures sit touch higher, with Eminis last around 6789, just off record highs above 6812.
- The CSI 300 index is off around 1.1% as we approach the lunchtime break. Recent cycle highs have been above 4726, while we last tracked near 4659. The 20-day EMA support point is back around 4547, with dips to this zone supported since early July.
- BBG notes: "Batteries and some materials-related stocks lead declines after China said it would impose export controls on some lithium batteries, critical materials, and related technology and equipment" These announcements followed yesterday's earlier rare earth export controls. Valuation concerns also linger.
- The HSI is off around 1% as well, while the HSTECH is down over 2.3%, tracking lower for the fifth straight session. We are no back close to the 20-day EMA (6294 versus 6311 current levels). The RSI (14) has corrected from overbought conditions, back to 54.
- Japan markets are weaker. The Topix down 1.7%, the MKY 225 off 1%. The uptrend in USD/JPY has stalled somewhat (back under 153.00), verbal rhetoric from the FinMin picked up a touch. Again, these markets are correcting from overbought levels from a technical standpoint.
- South Korea is bucking these trends, up 1.25% for the Kospi, as onshore markets return after the recent break. Chip/AI related firms like Samsung surged at the open.
- In South East Asia, most markets are down but only modestly. The exception is Thailand, which is off 1.9% and putting the SET back under 1300. BBG notes: "Delta Electronics shares slide after the stock exchange imposes market surveillance measures following their record-breaking rally.".
Want to read more?
Find more articles and bullets on these widgets:
Historical bullets
INDIA: US Trade Deficit With India Has Widened Over Last 5 Years
The FT reported that President Trump told European representatives that he’s prepared to impose the same tariffs as Europe on China and India for buying Russian energy. However, Trump also said he had spoken with his “good friend” Indian PM Modi and that trade negotiations were ongoing between them and that he expects “a successful conclusion for both”.
- On August 27 US import duties of 50% came into effect on Indian products. 25% was the reciprocal tariff, down only 1pp from the initial rate proposed, and another 25% was punitive for India’s significant imports of Russian oil which it has refused to stop purchasing. The US’s main export to India is oil and gas.
- India’s 2024 trade deficit with the US had almost doubled since 2020 but 2025 is on track to see it grow sharply but India has frontloaded shipments since March to beat duties and they could ease off over H2.
US trade deficit $bn 12mth sum
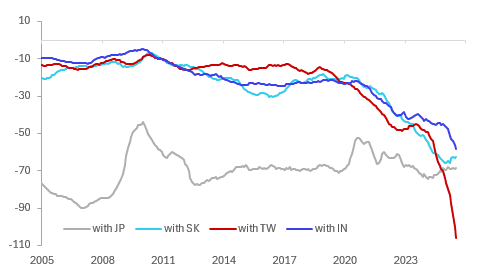
Source: MNI - Market News/LSEG
- India has one of the higher export shares to US in the region at 20% in 2024 but as a share of its economy it is low at only 2.6% of GDP.
- The main sectors impacted by higher US import duties are pharmaceuticals followed by miscellaneous manufacturing commodities, communications equipment, apparel and textile furnishings.
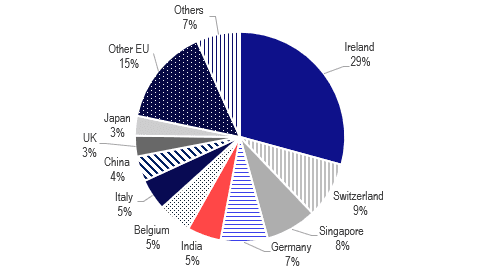
- India is only the 10th largest source of US merchandise imports worth 2.7% of the total and in terms of Asian countries it is behind Taiwan and South Korea who are facing US tariffs of 20% and 15% respectively. 5.2% of US pharmaceutical imports come from India, the 5th largest.
US imports of pharmaceuticals & medicines % total 2024
FOREX: JPY Crosses - Momentum Higher Stalls
US Equities drifted back towards all-time highs as it shrugged off another poor labour input and kept its focus on upcoming rate cuts, ignoring the concerns for growth. This morning US futures have opened slightly higher, E-minis +0.20%, NQU5 +0.10%. The JPY crosses move higher has again stalled, belatedly giving up all their Monday morning gains on the Ishiba news.
- EUR/JPY - Overnight range 172.14 - 173.16, Asia is trading around 172.50. The pair erased all its Mondays gains and has come back towards the middle of its recent range. The range looks to be 171.00-174.00 for now.
- GBP/JPY - Overnight 198.80 - 199.78, Asia trades around 199.35. This pair stalled again just above 200.00, a clear sustained break above 200.00 is needed to regain momentum higher.
- NZD/JPY - Overnight range 87.17 - 87.56, Asia is currently dealing 87.35. The pair’s move higher stalled and drifted lower overnight. Short-term looks to be 86.50-88.00 a break of which will see direction reassert itself. My bias remains to the downside.
- CNH/JPY - Overnight range 20.5634 - 20.7018, Asia is currently trading around 20.6900. This pair has remained above its pivotal 20.30/20.40 support. The pair continues to trade comfortably within its recent 20.40-21.00 range.
Fig 1 : NZD/JPY Daily Chart
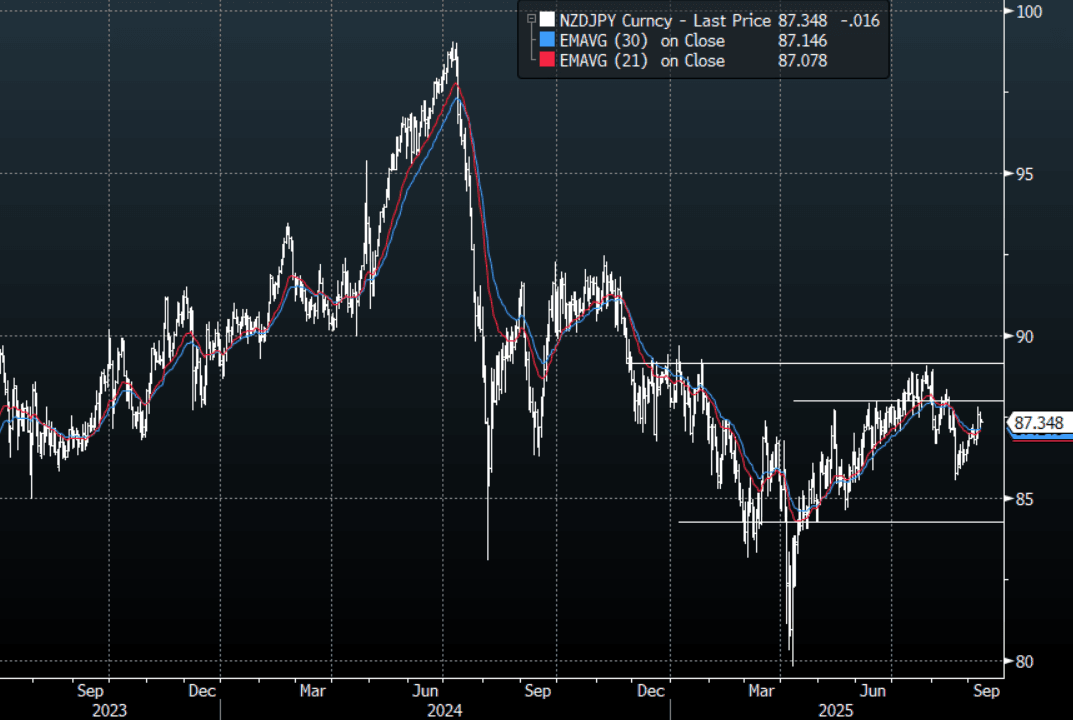
Source: MNI - Market News/Bloomberg Finance L.P
JGBS: Futures Upticks Faded, Focus On 5yr Debt Sale
JGB futures track at 137.78, -.22 versus settlement levels. We sit a touch above recent lows (137.69), while earlier highs this morning were at 137.86. The data calendar is quiet but we do have a 5yr JGB auction a little later. This will be in focus given recent mixed auction outcomes, as well as fresh political uncertainty, given the weekend decision by PM Ishiba to step down.
- Bear cycle risks for JGB futures still look to be in play. Recent lows were close to 137.20.
- In the cash JGB space, we are seeing some softness in back end yields, with the 30 and 40yr tenors down over 2bps. The 10yr is relatively steady, last near 1.58%. Front end yields are up a little over 1bps, the 2yr last around 0.86%. Some carry over from Tuesday headines around BoJ rate hike speculaiton may be aiding sentiment in this space
- The 5yr tracks at 1.12%. The average yield at the last auction was 1.056%. The chart below shows the historical bid to cover ratio for 5yr auctions.
- Via BBG: Mitsubishi UFJ Morgan Stanley Securities expects a solid result as "supply and demand for the short- to medium-term sectors should be firm for now."
Fig 1: Japan 5yr Debt Auction - Historical Bid To Cover Ratio
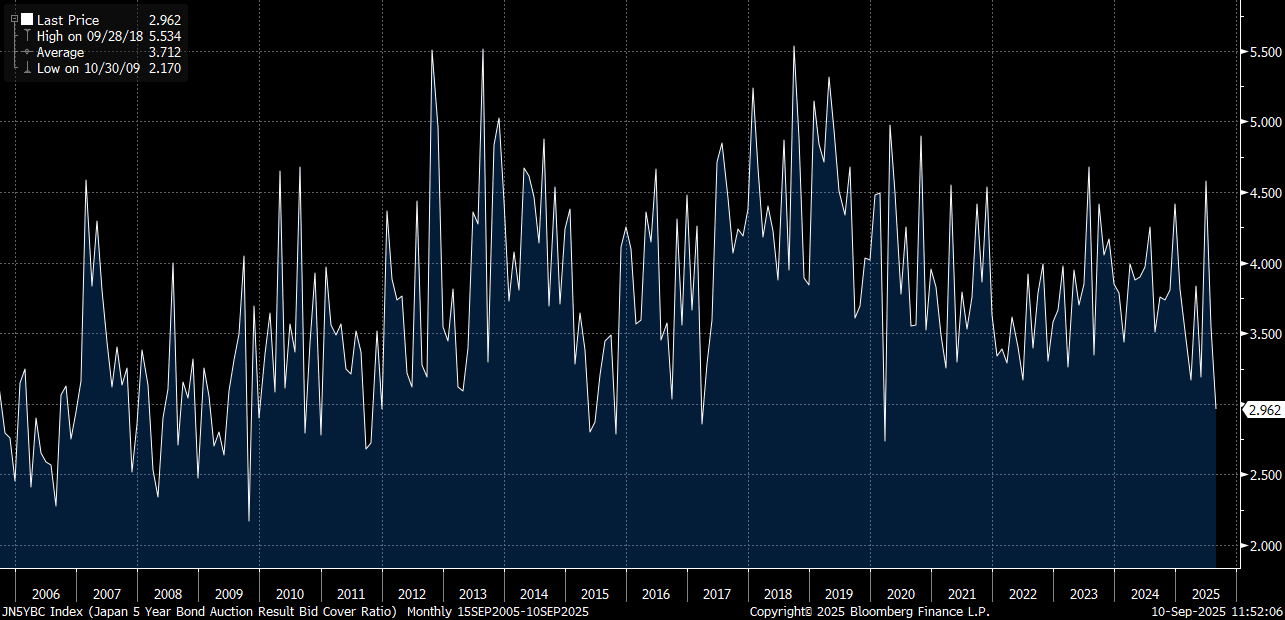
Source: Bloomberg Finance L.P./MNI