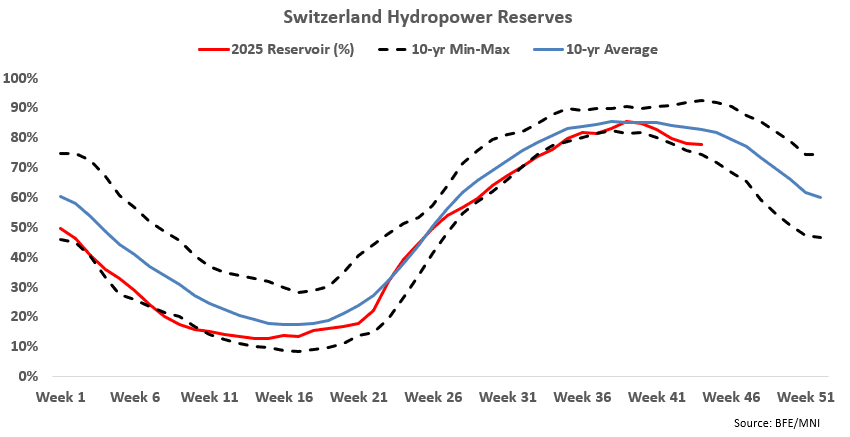
POWER: Swiss Hydro Stocks Edge Down, Widen Deficit to 5-Year Avg
Swiss hydropower reserves last week – calendar week 44 – declined by 0.3 percentage points to 77.9% of capacity, widening the deficit to the five-year average, BFE data showed.
- Stocks declined by 1.5 points the week prior.
- Reserves widened the deficit to the five-year average to 7.2 points, from 6.9 points the week before.
- The deficit to the ten-year average, however, narrowed to 4.9 points, from 5.4 points the week prior.
- Power demand in Switzerland last week increased by 407MW to 7.35GW.
- Swiss hydropower generation from pumped storage last week was broadly stable at 499MW, while output from reservoirs decreased by 217MW to 983MW. Run-of-river generation increased by 326MW to 1.61GW.
- Nuclear generation in Switzerland was broadly stable last week at 1.94GW.
- Alpiq’s 1.02 GW Gösgen nuclear power plant will be offline until 28 February 2026.
- Precipitation in Sion, in the hydro-intensive canton of Valais, last week stood at 19.6mm, below the seasonal average of 30.2mm.
- Snow height at L’Ecreuleuse in canton Valais stood at 72cm as of 4 November, up by 31cm in the past seven days, White Risk data showed.
- Looking ahead, the latest Bloomberg ECMWF weather forecast for Sion suggests broadly now precipitation this week – limiting inflows into reserves.
- The latest Swiss hydro balance is forecast to end this week at -927GWh. The balance is forecast to narrow to -1.55TWh as of 19 November.
Want to read more?
Find more articles and bullets on these widgets:
Historical bullets
USDCAD TECHS: Fresh Cycle High
- RES 4: 1.4111 High Apr 10
- RES 3: 1.4045 3.0% Upper Bollinger Band
- RES 2: 1.4019 38.2% retracement of the Feb 3 - Jun 16 bear leg
- RES 1: 1.3989 200-dma
- PRICE: 1.3953 @ 16:02 BST Oct 3
- SUP 1: 1.3897/3825 Low Sep 30 / 50-day EMA
- SUP 2: 1.3727 Low Aug 29 and a bear trigger
- SUP 3: 1.3689 Low Jul 28
- SUP 4: 1.3637 Low Jul 25
A bull cycle in USDCAD remains intact and yesterday’s break above the late September’s high, firms the bullish theme. This move higher also maintains the bullish price sequence of higher highs and higher lows. Note too that moving average studies are in a bull-mode position, highlighting a dominant uptrend. Sights are on 1.4019, a Fibonacci retracement point. On the downside, first key support lies at 1.3825, the 50-day EMA.
AUDUSD TECHS: Support Remains Intact For Now
- RES 4: 0.6763 1.382 proj of the Jun 23 - Jul 24 - Aug 21 price swing
- RES 3: 0.6726 1.236 proj of the Jun 23 - Jul 24 - Aug 21 price swing
- RES 2: 0.6660/6707 High Sep 18 / 17 and key resistance
- RES 1: 0.6629 High Sep 30 & Oct 01
- PRICE: 0.6603 @ 16:01 BST Oct 3
- SUP 1: 0.6527/21 61.8% of the Aug 21 - Sep 17 bull leg / Low Sep 26
- SUP 2: 0.6484 76.4% retracement of the Aug 21 - Sep 17 bull leg
- SUP 3: 0.6463/6415 Low Aug 27 / Low Aug 21 / 22 and a bear trigger
- SUP 4: 0.6373 Low Jun 23
The AUDUSD uptrend remains intact and recent weakness appears to have been a correction. Support to watch lies at the 50-day EMA, at 0.6558. A clear break of this average would signal scope for a deeper retracement and expose 0.6527 once again, a Fibonacci retracement. For bulls, a stronger reversal higher would refocus attention on 0.6707, the Sep 17 high. Initial resistance to watch is 0.6629, the Sep 30 and Oct 1 high.
US TSYS/SUPPLY: September's Coupon Auctions Were Generally Solid (2/2)
September’s coupon auctions were generally solid, with three lines trading through, two coming out on the screws and two tailing slightly.
- Looking through the lens of MNI’s Relative Strength Indicator (RSI), five lines saw positive readings while two saw negative readings.
- The 3-year sale was the strongest auction of the month according to MNI’s RSI. The 3-year line traded through 0.7bps, the largest stop through in seven months. Meanwhile, the primary dealer take-up was just 8.4%, the lowest on record (data going back to 2003).
- The weakest sale of the month was the last – the 7-year line. This line saw the second consecutive 0.5bp tail, with the 12.0% primary dealer take-up above August’s 9.8% and July’s record low 4.1%.
September Auction Review:
- 2Y Note on-the-screws: 3.571% vs. 3.571% WI.
- 2Y FRN: 0.200% high margin vs. 0.195% prior
- 3Y Note trade-through: 3.485% vs. 3.492% WI.
- 5Y Note tail: 3.710% vs 3.709% WI.
- 7Y Note tail: 3.953% vs. 3.948% WI.
- 10Y Note trade-through: 4.033% vs. 4.047% WI.
- 10Y TIPS: 1.734% high yield vs. 1.985% prior
- 20Y Bond trade-through: 4.613% vs 4.615% WI.
- 30Y Bond on-the-screws: 4.651% vs. 4.651% WI.
