OIL: Supply Trends To Pressure Prices, Market Watching Geopolitics
Oil has been trading in narrow ranges today and yesterday driven by holiday-affected thin volumes. Crude was 0.3% lower on Tuesday and is down slightly today and is set to post a decline of close to 1% and 20% in December and 2025 respectively as concerns regarding a record 2026 surplus driven by higher OPEC and non-OPEC output outweighed ongoing geopolitical tensions in oil-exporting regions.
- WTI is down 0.2% to $57.86/bbl and has traded in a range of $57.79/57.96, while Brent is 0.1% lower at $61.28/bbl after a high of $61.33 followed by a low of $61.16.
- Inventory data are being monitored for signs of excess supply and Bloomberg reported a US crude inventory build of 1.7mn barrels with 800k at Cushing last week, according to people familiar with the API data. There were also product builds. The official EIA data will be released Wednesday.
- While geopoliticals are unlikely to drive oil price trends, unless there’s a surprise, they could provide a floor and drive volatility. The market will watch developments closely.
- Negotiations for a Ukraine peace will be monitored with attacks on Russian energy infrastructure also likely to impact the market. Today Russia reported extinguishing a fire at its Tuapse refinery.
- The US blockade of Venezuela continues and storage facilities in the country are filling up driving cuts to production. US strikes on docks and alleged narcotics boats will also be watched. The US has also bombed militants in Nigeria.
- Protests in Iran, a resumption of its nuclear programme and general Middle East stability will remain a focus given the region provides over a third of global oil exports, according to the International Association of Oil & Gas Producers.
- Later US jobless claims print. European stock markets are either closed or have early finishes, which includes the UK.
Want to read more?
Find more articles and bullets on these widgets:
Historical bullets
PRECIOUS METALS: Silver Continues Outperformance, US ISM Later
Continuing Friday’s pattern, silver is outperforming gold in Monday’s APAC session. Silver benefits from high physical demand and the market is currently tight. Prices are up 1.3% to $57.22/oz after an intraday high of $57.864, a new record, and 5.8% rise on Friday. In comparison, gold is flat today at $4238.7/oz reaching $4256.48 earlier and rising 2.0% on Friday. Both metals have found support from increased Fed rate cut pricing which is now at 23pp for the 10 December decision. Yields and the US dollar are little changed today.
- Silver moved above the bull trigger at $54.480 and three other resistance levels including $56.153, a Fibonacci projection, confirming a resumption of the primary uptrend.
- Bloomberg reported that silver inventories in the Shanghai Futures Exchange have fallen to their lowest in almost 10 years.
- However, Pepperstone Group believes that silver is being driven by “speculative flows” which given the substantially lower volumes than gold is creating the recent large price moves.
- Equities are mixed with the S&P e-mini down 0.7% and Nikkei -1.8% but Hang Seng is up 0.8% and SE Thai +0.8%. Oil prices are higher with WTI +1.6% to $59.50/bbl. Copper is up 1.5%.
- Later US November manufacturing ISM/PMI, UK October lending and European November manufacturing PMIs are released.
USD: BBDXY - USD Moves Lower In Asia, Dragged Down By USD/JPY
The BBDXY range Friday night was 1217.18 - 1221.55, Asia is currently trading around 1217, -0.05%. Risk has turned very quickly to start the week in Asia thanks to a combination of poor Chinese PMI’s over the weekend and Japanese yields continuing to extend higher as the market prices in a potential December BOJ rate hike. The USD moved lower initially as Asia tends to follow the moves seen in USD/JPY, I suspect we might see this start to differentiate once London comes in. On the day I will be watching to see if the USD can bounce against risk currencies should this risk-off start to the week expand on its initial moves. On the day resistance is back towards the 1222-1224 area where sellers should remerge initially, a sustained break back above here and the market would again turn its focus to the pivotal 1230-1240 area.
- The BBDXY Average True Range for the last 10 Trading days: 366 Points
Fig 1: BBDXY Daily Chart
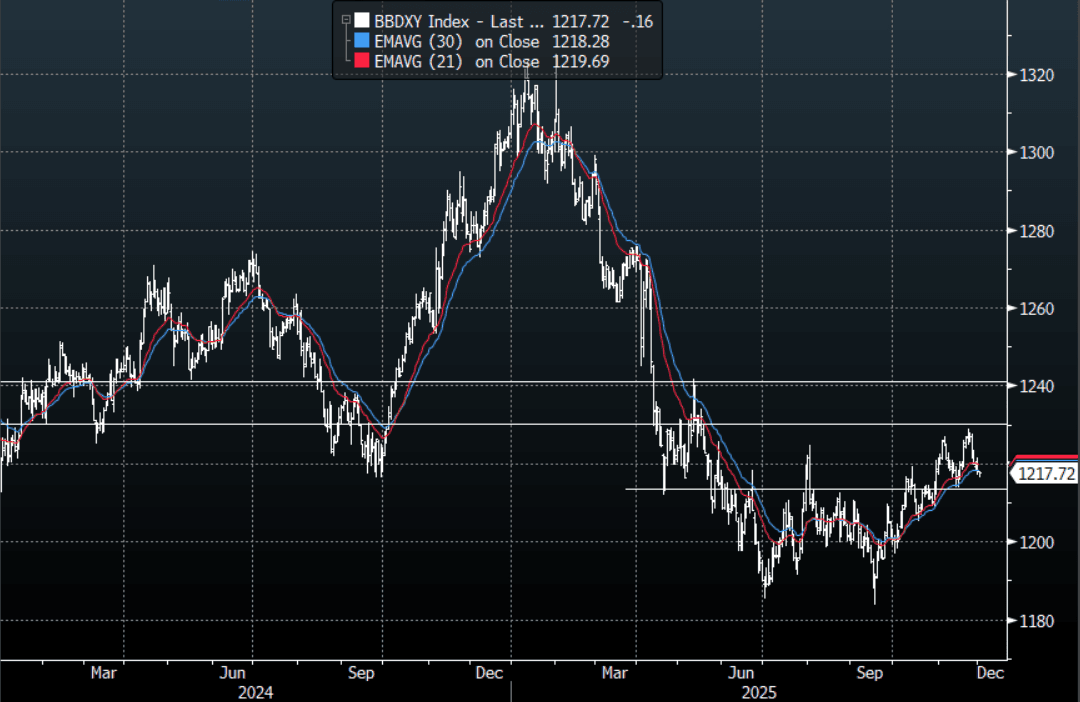
Source: MNI - Market News/Bloomberg Finance L.P
CRYPTO: Bitcoin - Collapses Over 4% As Risk Starts The Week Under Pressure
Bitcoin had a range over the weekend of $90,219.28k - $91,968.70k, Asia is currently trading around $87,200k, -4.40%. Risk has turned very quickly to start the week in Asia thanks to a combination of poor Chinese PMI’s over the weekend and Japanese yields continuing to extend higher as the market prices in a potential December BOJ rate hike. Bitcoin struggled hard to climb back up the stairs and it has just slipped very easily back down the elevator. I really thought we might see levels closer to $100k to be able to fade but at the first hint of risk stalling the Crypto space has tumbled. Price action suggests the move lower might not be quite as finished as many were hoping. First support is back toward the $84k-$86k area, a break below here and the market will again turn its focus back to the $70k-$75k support. The $95-$100k area still looks like the place the market might like to initiate shorts if given the opportunity.
- EndGame Macro expanded on this morning's move on X: “The timing isn’t random. Yields across the world have been creeping higher again, U.S. bonds, Japan’s curve, all of it. That’s a quiet signal that liquidity isn’t loosening yet. And layered on top of it is the reality that the Fed ending QT tomorrow doesn’t automatically mean liquidity is flooding back into markets tomorrow.”
- “This wasn’t Bitcoin failing. This was leverage getting cleared out because the macro backdrop pulled the rug from underneath a crowded trade. The long term story hasn’t changed, but the short term path is still shaped by a world where rates are high, liquidity is slow, and global funding conditions are tightening at the edges.”
- Bitcoin’s Average True Range(ATR) for the last 10 Trading days: 3,111 Points
Fig 1: Bitcoin spot Daily Chart
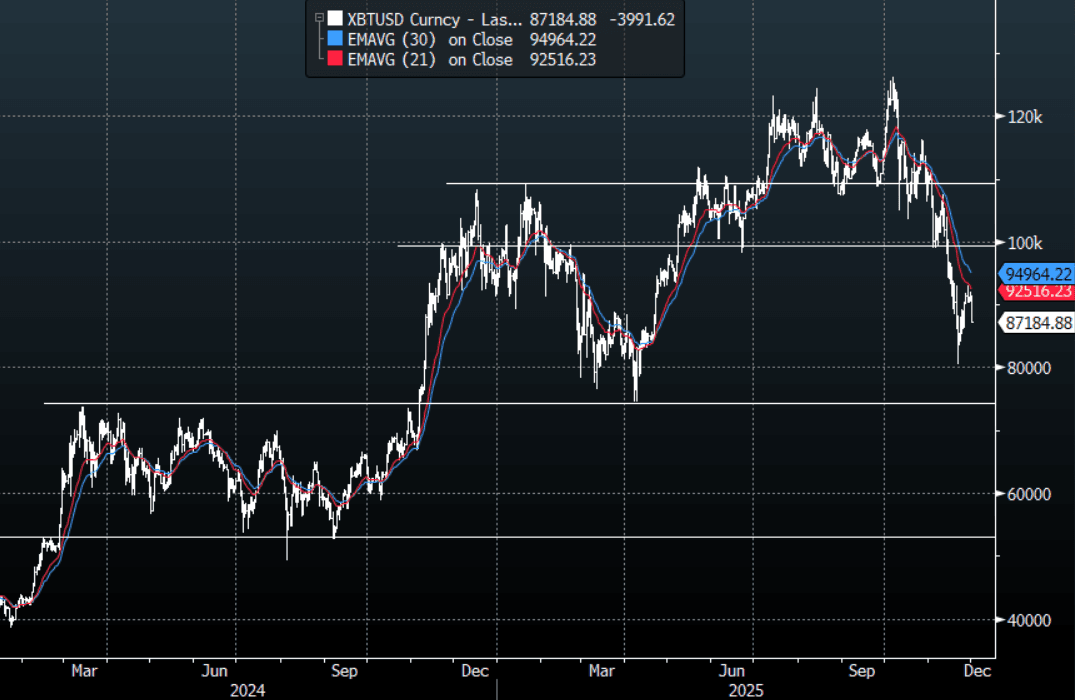
Source: MNI - Market News/Bloomberg Finance L.P