ASIA STOCKS: Strong Flows into the End of the Week for Asian Stocks
May-16 01:53
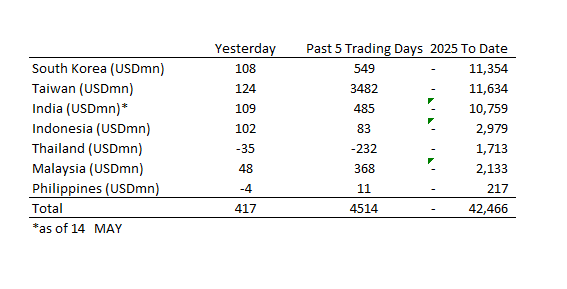
Equity flows have been very strong throughout the week led by Taiwan as flows over the last five trading days reach USD$4.5bn
- South Korea: Recorded inflows of +$108m as of yesterday, bringing the 5-day total to +$549m. 2025 to date flows are -$11,354m. The 5-day average is +$110m, the 20-day average is +$16m and the 100-day average of -$129m.
- Taiwan: Had inflows of +$124m as of yesterday, with total inflows of +$3,482m over the past 5 days. YTD flows are negative at -$11,634. The 5-day average is +$696m, the 20-day average of +$371m and the 100-day average of -$134m.
- India: Had inflows of +$109m as of the 14th, with total inflows of +$485m over the past 5 days. YTD flows are negative -$10,759m. The 5-day average is +$97m, the 20-day average of +$286m and the 100-day average of -$126m.
- Indonesia: Had inflows of +$102m as of yesterday, with total inflows of +$83m over the prior five days. YTD flows are negative -$2,979m. The 5-day average is +$17m, the 20-day average -$40m and the 100-day average -$32m
- Thailand: Recorded outflows of -$35m as of yesterday, outflows totaling -$232m over the past 5 days. YTD flows are negative at -$1,713m. The 5-day average is -$46m, the 20-day average of -$18m the 100-day average of -$18m.
- Malaysia: Recorded inflows of +$48m as of yesterday, totaling +$368m over the past 5 days. YTD flows are negative at -$2,133m. The 5-day average is +$74m, the 20-day average of +$35m and the 100-day average of -$24m.
- Philippines: Saw outflows of -$4m as of yesterday, with net inflows of +$11m over the past 5 days. YTD flows are negative at -$217m. The 5-day average is +$2m, the 20-day average of +$4m the 100-day average of -$3m.
Want to read more?
Find more articles and bullets on these widgets:
Historical bullets
CHINA: House Price Declines Continue in March
Apr-16 01:41
- March’s New and Used home price declines continue, albeit with a moderate improvement.
- New home prices declined -0.08% MoM from -0.14% in February.
- The price decline for new homes YoY was -4.99%, from -5.22% in February.
- New house prices did rise in 24 cities MoM versus 18 in February, but only 2 cities rose YoY.
- Used home prices declined -0.23% MoM from -0.34% in February.
- The price decline for used homes YoY -7.25%, from -7.53% in February.
- No cities have recorded rises in used home prices YoY.
- The data release is more of the same. There was limited expectation for a material bounce in prices given the volume of unsold properties.
- There is much discussion around possible further monetary and or fiscal response for the economy and later today’s 1Q GDP may prove a better guidance as to the path for policy.
AUSTRALIA DATA: Westpac Index Weakens, Likely To Continue In April
Apr-16 01:29
The Westpac leading index for March fell 0.11% m/m leaving the 6-month annualised rate at 0.6% down from 0.9% in February. There are signs of the impact of the recent US tariff announcements in some of the components. The 6-month rate leads detrended growth by 3 to 9 months and it continues to signal a recovery but heightened uncertainty started to weigh in March and the April index is likely to be more severely affected given the April 2 US reciprocal tariff announcement.
- The uncertainty of the global trade situation, especially regarding China, along with market volatility are likely to be the main influences on the Westpac leading index and Australia’s economy in the coming months. There is little direct exposure to the US but its trade war with China, Australia’s largest export destination, is the concern.
- Westpac has revised down its 2025 Australian growth forecast to 1.9% y/y from 2.2% with risks skewed to the downside due to recent global developments. It is forecasting a 25bp rate cut at the May 20 RBA meeting driven by Q1 data showing a “sustained” inflation slowdown and elevated global uncertainty with the situation likely to drive a more dovish tone.
- The 0.9pp improvement in the 6-month rate over the last 6 months was driven by commodity prices, which was due to the weaker AUD, wider yield spread, stronger US IP and better unemployment expectations. However, softer Australian equities and consumer sentiment weighed, which is likely to continue given recent market nervousness and the April 6% drop in confidence.
CHINA: Central Bank Drains Liquidity via OMO
Apr-16 01:25
- The PBOC issued CNY104.5 bn of 7-day reverse repo at 1.5% during this morning’s operation.
- Today’s maturities CNY118.9bn
- Net liquidity withdrawal CNY14.4bn.
- The PBOC monitors and maintains liquidity through the issuance of reverse repo.
- The CFETS Pledged Repo Deposit Institutions 7 Day Weighted Average is at 1.51%, from 1.71% yesterday.
- The China Overnight interbank repo rate is at 1.70%, from 1.70% yesterday.
- The China 7-day interbank repo rate is at 1.52%, from 1.71% yesterday.
