US TSYS: Strong Dovish Data React Lifts Projected Rate Cut Pricing
- Treasuries look to finish higher Thursday, off early post-data highs on heavier two-way flow. Treasury futures extended lows briefly (TYZ5 113-09) before rebounding / gapping higher post data: slightly higher than expected August CPI MoM inflation, while weekly claims come out much higher than expected.
- Core goods prices accelerated to 0.28% M/M from 0.21% prior, a little shy of expectations of a rise to the low 0.30s. This slight "miss" appears down to used car prices on the soft side of expectations at 1.0% M/M, still a 7-month high but vs expectations of a little above that figure.
- Initial jobless claims surprisingly jumped to 263k (sa, cons 235k) in the week to Sep 6 after a slightly downward revised 236k (initial 237k). Note that in the NSA jobless claims details, national claims increased 7.9k on the week but 15.3k of that came from Texas. Continuing claims on the other hand surprised lower at 1939k (sa, cons 1950k).
- Currently, the Dec'25 10Y trades +4 at 113-22.5 (yld 4.00547% -.0401) vs. 113-29 high - through initial technical resistance at 113-21.5 (High Sep 5) and 113-26.5 (2.764 proj of the Jul 15 - 22 - 28 price swing). Next level round number resistance at 114-00.
- Projected rate cut pricing gained traction vs. morning/pre-data levels (*): Sep'25 at -27.2bp (-27.1bp), Oct'25 at -50.1bp (-46.4bp), Dec'25 at -73.2bp (-68bp), Jan'26 at -86.1bp (-80.4bp).
- Focus Friday shifts to the UK activity data, in which markets expect both industrial and manufacturing production to slow on a monthly and yearly basis - underscoring a slower level of monthly GDP growth into Q3. French and German inflation numbers are also due, but it's the prelim University of Michigan sentiment numbers that should prove more decisive.
Want to read more?
Find more articles and bullets on these widgets:
Historical bullets
AUDUSD TECHS: Consolidation Mode
- RES 4: 0.6700 76.4% retracement of the Sep 30 ‘24 - Apr 9 bear leg
- RES 3: 0.6688 High Nov 7 ‘24
- RES 2: 0.6677 0.764 proj of the Jun 23 - Jul 11 - 17 price swing
- RES 1: 0.6541/6625 High Aug 7 / 24 and the bull trigger
- PRICE: 0.6521 @ 16:04 BST Aug 12
- SUP 1: 0.6419 Low Aug 1
- SUP 2: 0.6373 Low Jun 23 and a bear trigger
- SUP 3: 0.6354 38.2% retracement of the Apr 9 - Jul 24 upleg
- SUP 4: 0.6323 Low Apr 16
AUDUSD rallied well off the week’s lowest levels last week on broad USD weakness - erasing any signs of a bearish breakout on the show through the 20- and 50-day EMAs. While support at 0.6455 the Jul 17 low, has been cleared, the recovery in prices keeps key resistance in focus at 0.6625 the Jul 24 high. It also represents the bull trigger. Any return lower would signal a bearish threat into 0.6373, the Jun 23 low.
EURJPY TECHS: Trend Structure Remains Bullish
- RES 4: 177.08 2.000 proj of the Feb 28 - Mar 18 - Apr 7 price swing
- RES 3: 175.43 High Jul 11 ‘24 and a key medium-term resistance
- RES 2: 174.86 1.764 proj of the Feb 28 - Mar 18 - Apr 7 price swing
- RES 1: 173.97 High Jul 28 and the bull trigger
- PRICE: 172.76 @ 16:03 BST Aug 12
- SUP 1: 169.73/45 Low Jul 31 / 23.6% of the Feb 28 - Jul 28 bull leg
- SUP 2: 169.71 50-day EMA
- SUP 3: 168.46 Low Jul 1
- SUP 4: 167.46 Low Jun 23
A bullish trend condition in EURJPY remains intact and for now the recent move down is considered corrective. Key support to watch lies at the 50-day EMA at 169.62. A clear break of the EMA is required to highlight a stronger short-term bearish threat. Moving average studies remain in a bull-mode position highlighting an uptrend. A break of the Jul 28 high of 173.97, would resume the bull cycle.
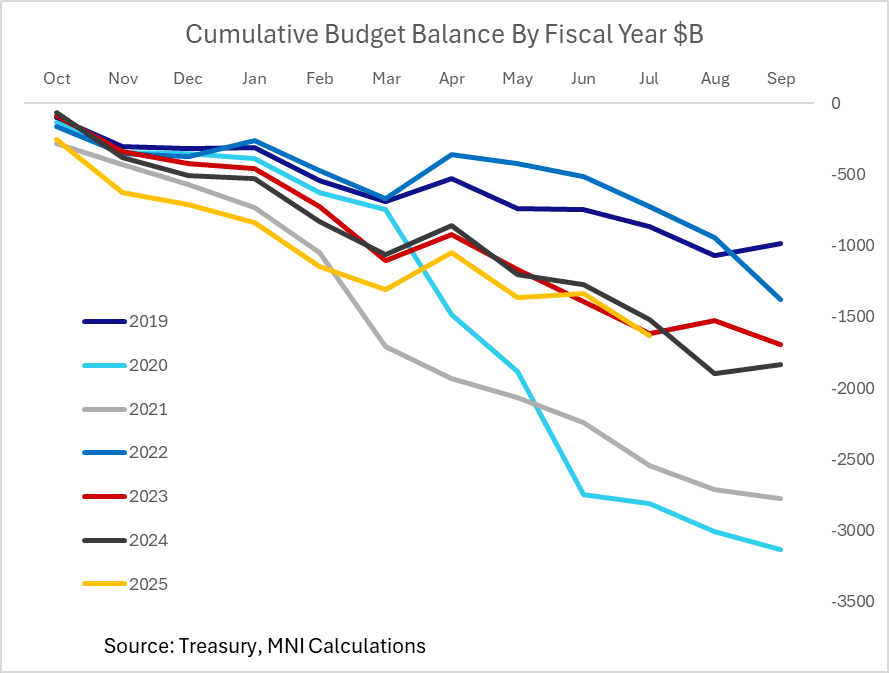
US FISCAL: Federal Deficit Up 7% Y/Y With 2 Months To Go In Fiscal Year
Treasury reported a $291.1B federal budget deficit in July, larger than the $239B shortfall expected by Bloomberg consensus but almost exactly in line with the Congressional Budget Office's previously published $289B estimate.
- As MNI noted previously, while the year-to-date deficit is up 7% Y/Y to $1.629T with two months remaining in the 2025 fiscal year (which runs Oct-Sep), compared with $1.517T in the same period of FY2024, the difference is smaller when adjusting for timing changes.
- CBO estimated a $37B wider deficit when accounting for these changes, vs $109B "actual". The implied adjusted rise in the deficit is around 2% Y/Y, tracking lower than nominal GDP growth over that period.
- YTD revenue is up 6.4% Y/Y ($4.346T), with expenditure up 6.7% ($5.975T).
- At the start of 2025, CBO estimated a $1.9T deficit this fiscal year which remains plausible with August typically seeing a large deficit ahead of a better outturn in September in part on tax receipts, though looks on the high side at this point.
- That implies the FY2025 deficit looks closer to coming in below the 6.4% of GDP posted in FY2024, though is widely expected to re-expand in FY2026 largely on "One Big Beautiful Bill" effects.
- CBO will publish the Monthly Budget Review with its final projection next month.