INTERNATIONAL TRADE: Still No Clear Signs Of China-EU Trade Diversion In June
Chinese trade data continues to suggest that transhipments into the US via third countries such as Vietnam is a more clearly observable dynamic than disinflationary trade diversion to the likes of the EU.
- Last week, we highlighted the strength of Vietnamese and Taiwanese exports to the US in June, with import growth from China simultaneously rising. Chinese trade data for June unsurprisingly corroborates these themes.
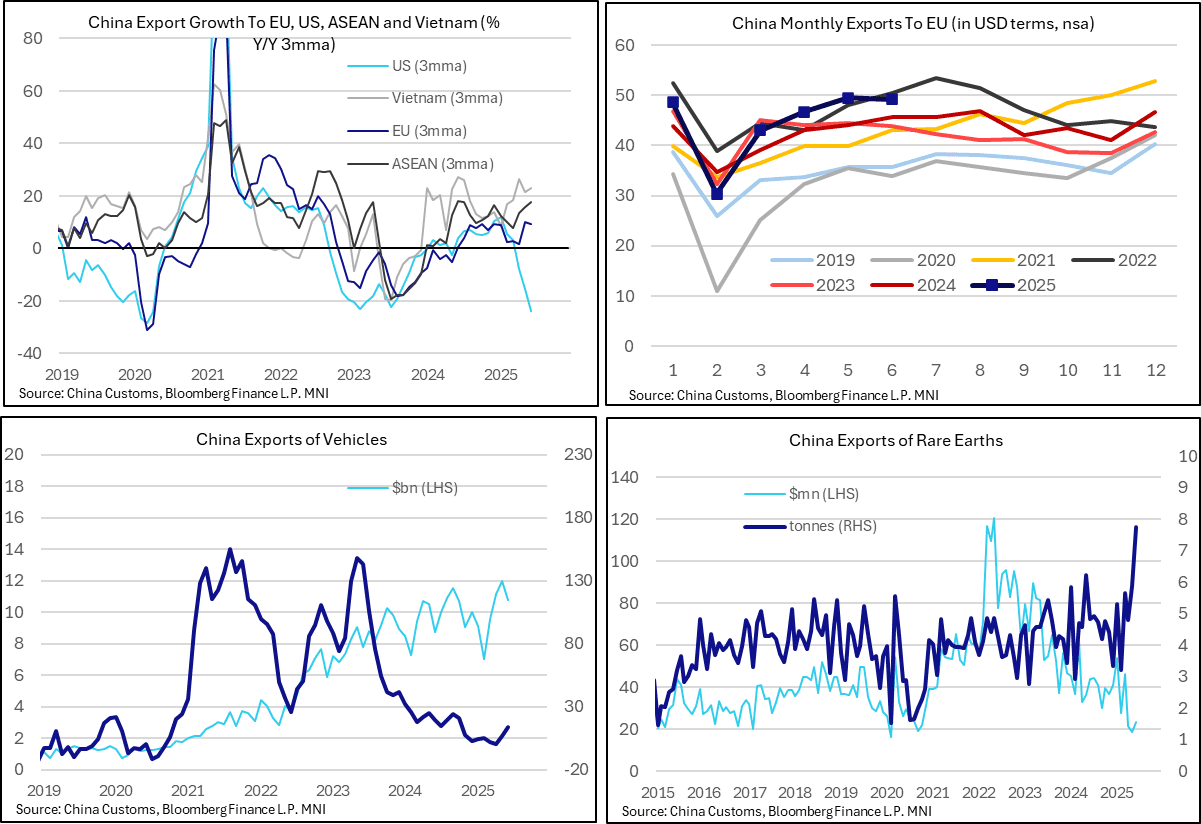
- Direct exports to the US fell 16.1% Y/Y (vs 34.4% prior) in June. On a 3mma Y/Y basis, export growth to the US was -23.8%, the weakest since April 2020.
- Meanwhile, exports to the EU totalled USD49.2bln (vs USD49.5bln in May). That’s still growth of 7.6% Y/Y (vs 12.1% prior), and a 3mma Y/Y rate of 9.3%. However, the figures do not stand out as seasonally strong, but rather in line with the consistent growth in Chinese exports to Europe over the past few years.
- In its latest report on the sustained decline in German export market shares, the Bundesbank noted that in recent years, “China increasingly emerged as a competitor of German firms.”…“Since 2019, in dealings with its most important trading partners, the German export industry has tended to lose more market share in the very areas where China has gained ground,”
- Chinese global vehicle exports totalled USD10.7bln in June, up 23.1% Y/Y (vs 13.7% prior). Vehicle exports have been on a consistent upward trend since 2021. According to Eurostat data, EU road vehicles imports from China totalled E2.2bln in April.
- June trade data also indicated a sharp rise in the volume of Chinese rare earth exports to 7,742 tons (up 60% Y/Y). However, the value of rare earth exports was still down 46.9% Y/Y at USD23.2mln. A reminder that the China/US trade framework struck in Vienna in May (and then finalised in London in June) included a commitment from China to deliver rare earths to the US.
Want to read more?
Find more articles and bullets on these widgets:
Historical bullets
US FISCAL: Available Extraordinary Measures Pick Up Ahead Of Tax Date
Treasury had $144B in "extraordinary measures" available to keep the government financed as of June 11 per a release Friday. That is up from $84B a week earlier and the highest since April 28.
- However, TGA cash continues to fall, to $309B latest (lowest since early April) Combined with a pullback in Treasury cash ($376B), keeping the total resources available to avert an "x-date" in the summer at around $450B .
- There will be another uptick in Treasury cash in the coming days, and it's likely Treasury allowed some of the extraordinary measures to be rebuilt (ie not exercised) in anticipation of more cash coming in.
- This is likely to be the last major uplift before the summer at which point x-date speculation will pick up if Congress hasn't passed a debt limit increase by then.

FED: Two Cuts Priced This Year Headed Into FOMC Week
As we head into the June Fed meeting week, market pricing is reflective of the FOMC’s messaging (that we describe in our preview):
- The next cut is only fully priced by the October FOMC meeting, with September seeing a roughly 80% implied probability of bringing the next 25bp reduction.
- Exactly 50bp of cuts are priced through end-2025, implying two Q4 cuts.
- That’s a shift from just after the May meeting, after which the next cut was fully priced by September, and there were closer to three cuts priced for the rest of the year.
- Overall cuts are seen backloaded this year (after 15bp in September, 29bp of cuts priced in Q4 - Oct/Dec combined), but falls off in Q1 (just 21bp cuts priced, 9bp of cuts priced for January and 12bp for March)

FED: Summary Of Economic Projections: Higher 2025 Inflation, Weaker Growth
The MNI Markets Team’s expectations for the updated Economic Projections are below.
- As of the May meeting, the Federal Reserve staff – whose outlook tends to be broadly shared by the median Committee member – revised their forecasts for growth weaker in 2025 and 2026, “as announced trade policies implied a larger drag on real activity relative to the policies that the staff had assumed in their previous forecast. Trade policies were also expected to lead to slower productivity growth and therefore to reduce potential GDP growth over the next few years. With the drag on demand expected to start earlier and to be larger than the supply response, the output gap was projected to widen significantly over the forecast period. The labor market was expected to weaken substantially, with the unemployment rate forecast moving above the staff's estimate of its natural rate by the end of this year and remaining above the natural rate through 2027."
- On inflation, "The staff's inflation projection was higher than the one prepared for the March meeting. Tariffs were expected to boost inflation markedly this year and to provide a smaller boost in 2026; after that, inflation was projected to decline to 2 percent by 2027."
- Our expectations for these changes fall somewhere in between those projections and the March SEP – a slightly higher unemployment rate, substantially higher inflation in 2025 but to a lesser extent in 2026, and weaker GDP growth this year. Longer-run variables should be unchanged.
MNI Markets Team Expectations For June 2025 Summary Of Economic Projections Medians
