US DATA: Something For Everyone In Philly Survey, But Inflationary Either Way
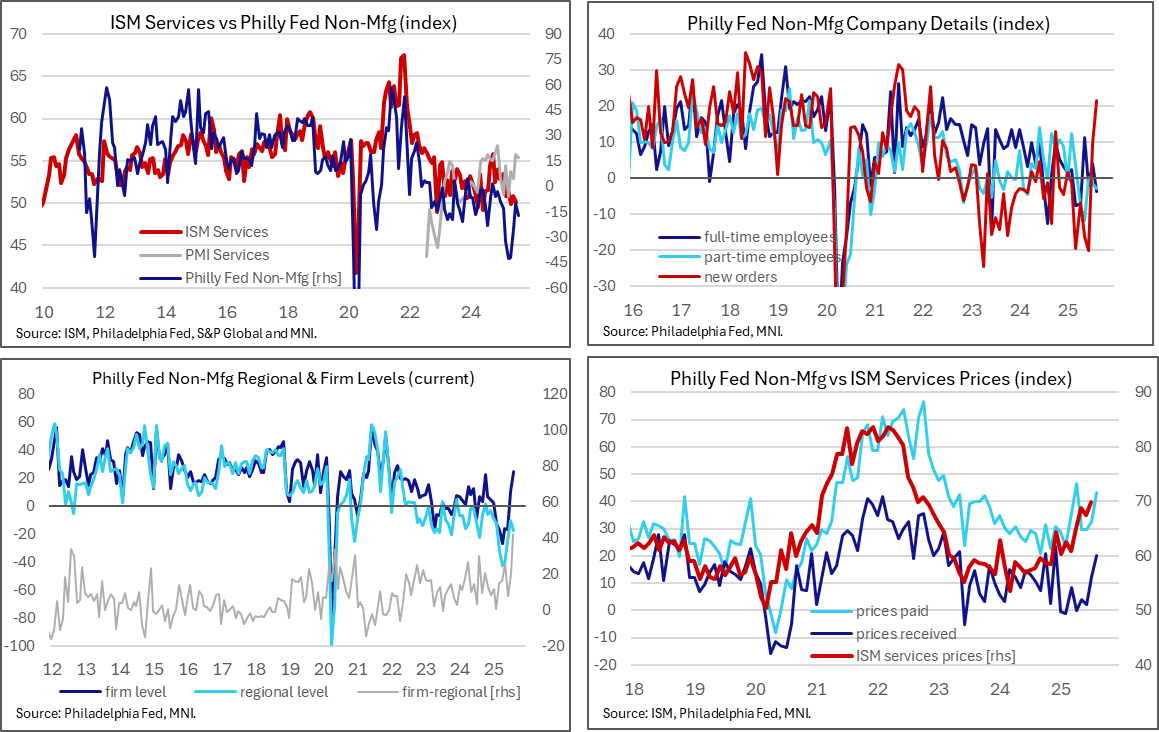
The Philly Fed non-manufacturing survey pointed to a stagflationary environment when taking firms' views on the regional economy or an outright inflationary environment when focusing on their own firm-level activity. Own-level activity and new orders increased to their highest since Mar 2022 whilst prices received saw their highest since December.
- The Philly Fed non-manufacturing index slipped to -17.5 in August from -10.3 in July after the latter had been its least negative since January.
- However, this index, which appears on screens, is for the assessment of regional activity and it masks what has been a much stronger activity index when firms answer considering their own activity. This firm-level activity index rose from 10.2 to 24.6 for its highest since Mar 2022.
- It’s a new recent high in the discrepancy between firms own and regional activity, potentially a sign of uncertainty facing firms.
- This firm-level strength was helped by a 12pt rise in the new orders index to 21.5 (also highest since Mar 2022) whilst the sales/revenues index moved up 6pts to 17.5 (highest since October).
- Employment indexes weren’t as encouraging however, with the full-time index falling 8pts to -3.8 as it continued a pattern of alternating between positive and negative readings. 62% of firms reported no change in employment. The average workweek index did however rise 5pts to 17.3 for a third consecutive positive reading.
- Price indexes “suggest widespread increases in prices for inputs and for the firms’ own goods and services overall.” Prices paid increase 11pts to 43.2 (highest since April) whilst prices for the firms’ own prices received index increased 8pts to 20.1 (highest since December).
- As for six-month ahead indexes, the regional activity index did at least increase from -3.9 to 1.3 for its first positive reading since January having troughed at -31.8 in April. The firm-level index meanwhile increased to 21.2 (also highest since Jan) after three months in a narrow range between 11.6-12.3.
- Survey responses collected from Aug 11-21.
Want to read more?
Find more articles and bullets on these widgets:
Historical bullets
FED: MNI Fed Preview-June 2025: Dividing Lines
Our July Fed preview has just been published - Download Full Report Here
- With the Fed almost certain to hold the funds rate at 4.25-4.50% again at the July 29-30 meeting, focus will be on the degree to which the Committee signals openness to rate cuts resuming in the fall.
- The policy statement is unlikely to see meaningful changes, though Governor Waller and Vice Chair Bowman are widely expected to dissent in favor of a rate cut.
- The message from July is likely to look similar to that of June: a fairly divided Committee retains its overall easing bias but individual participants need varying degrees of certainty before supporting a resumption of the easing cycle.
- Chair Powell is likely to repeat many of his messages from the prior meeting, noting that the Committee's median expectation is for two cuts by year-end albeit dependent on the data in the interim.
- He is likely to point out that the Committee will see two inflation and employment reports by the next meeting in September, with more clarity on the impact of tariffs on consumer prices and activity, and potentially less uncertainty over the policy outlook.
- In other words, the patient approach remains, but the September meeting will the most “live” so far this year.
- Apart from the current thinking on a September cut, areas of interest for the press conference include whether the Committee’s view on neutral rates has shifted, and whether Fed balance sheet management was discussed.
- MNI’s separate preview of sell-side analyst summaries to follow on Monday Jul 28
US TSYS: Risk Sentiment Improves Over Early Trade Headlines
- Treasuries look to finish near late session highs (curve reverse early steepening to mildly flatter) after a lower open, risk sentiment gained after early trade related headlines ("nearing deal with China", "50/50" chance of deal with EU).
- Little initial reaction in Tsys after mixed data (Durable orders slightly better than expected), Cap orders lower than expected w/ prior up-revised. June's advance durable goods report showed renewed weakness in core orders to end Q2, a potential sign of softer business investment and manufacturing in the months ahead.
- The Kansas City Fed's Tenth District Services survey showed a sharp drop in the composite index in July to -5 from positive 3 prior, marking a 19-month low. This was in contrast to the previously released KC regional manufacturing survey which showed an unexpectedly strong improvement.
- Tsy Sep'25 10Y contract trades +5 at 110-31.5 (111-00.5 high). Initial technical resistance at 111-14.5 (Jul 22 high), a clear break of it would highlight a stronger reversal and open 111-28, the Jul 3 high. Key support remains intact at 110-08+, the Jul 14 and 16 low. A move through this support would reinstate a bearish theme. Curves bull flatten: 2s10s -.831 at 46.704, 5s30s -0.077 at 97.326.
- Cross asset: Bbg US$ index off early highs: BBDXY +3.35 at 1198.55; stocks extending record highs (SPX eminis at 6431.0); gold down -29.02.52 at 3339.66.
US TSYS: Late SOFR/Treasury Option Roundup: Sticking With Puts
SOFR & Treasury options continued to rotate around downside put structures Friday with a couple exceptions (+25k Sep'25 2Y Call spd for instance). Underlying futures well off lows after the bell, curves mixed with 2s10s -0.831 at 46.704, 5s30s +.231 at 97.634. Projected rate cut pricing gained slightly vs. morning (*) levels: Jul'25 at -0.06bp, Sep'25 at -16.6bp (-16.4bp), Oct'25 at -28.1bp (-27.1bp), Dec'25 at -44.2bp (-43.1bp). Year end projection well off early July level of appr -65.0bp.
- SOFR Options:
- +10,000 0QZ5 96.37/96.62 2x1 put spds, 1.25/legs
- Block 5,000 SFRV5 96.06/96.18/96.31/96.50 call condors, 2.0 net
- 8,750 SFRZ5 95.37/95.62 2x1 put spds ref 96.08
- -40,000 SFRZ5 95.37/95.62 put spds, 0.37 ref 96.07
- 8,000 SFRZ5 95.93/96.18 put spds vs. SFRH6 96.25/96.50 put spds
- 10,000 SFRQ5 95.62/95.87 put spds ref 95.825
- 1,250 SFRQ5 95.93/96.06 2x3 call spds ref 95.825
- Blocks, 5,000 SFRQ5 95.75/95.87 call spds, 6.5
- Blocks, 10,000 SFRQ5 95.75/95.81/95.87/95.93 put condors, 2.5 net
- 1,000 SFRZ5 96.25/96.37/96.62/96.75 call condors ref 96.055
- 1,750 0QQ5 96.56 puts, ref 96.68
- Treasury Options:
- 3,000 TYU5 106.5/108 put spds, ref 110-31
- +25,000 TUU5 104.25/104.5 call spds, 1 vsd. 103-18.5/0.05%
- -10,000 TYU5 109.5/112 strangles, 29 ref 110-26.5 (appr 5.49% imp vol)
- 2,500 TYU5 112/113/114 call flys, 5 net ref 110-26
- 5,000 TYU5/TYV5 109.5 put spds 21
- 4,875 FVU5 108.75 calls ref 108-05.75
- 4,000 TUU5 104.25 calls ref 103-19.25
- 8,000 USU5 109 puts, 19
- 3,750 TYU5 111.5 calls, 25
- over 5,000 TYQ5 110.75 puts, 4 last
- over 7,400 TYU5 111 calls, 37 ref 110-25.5
- 5,000 wk1 TY 109/109.75 put spds (exp 8/1)