FED: SOMA Manager Perli: "Early Signs" Reserves Dipping To "Ample" Levels
The Fed's SOMA portfolio manager, Roberto Perli, reiterated in a speechThursday that reserves remained "abundant" but that there were "early signs" that the transition to "ample" was underway (text here).
- Perli: "it’s hard to estimate exactly what constitutes an ample level of reserves", but it's somewhere between $1.5T (Sept 2019 when reserves "evidently became less than ample") and $3.2T (current level, "market indicators still point to reserves remaining abundant").
- In terms of other liabilities that impact available reserves, "while I expect the overnight reverse repo (ON RRP) facility to dwindle to minimal levels once the debt limit situation is addressed, other liabilities are likely to remain sizeable" (including currency in circulation, the Treasury General Account, and other deposits held at the Fed).
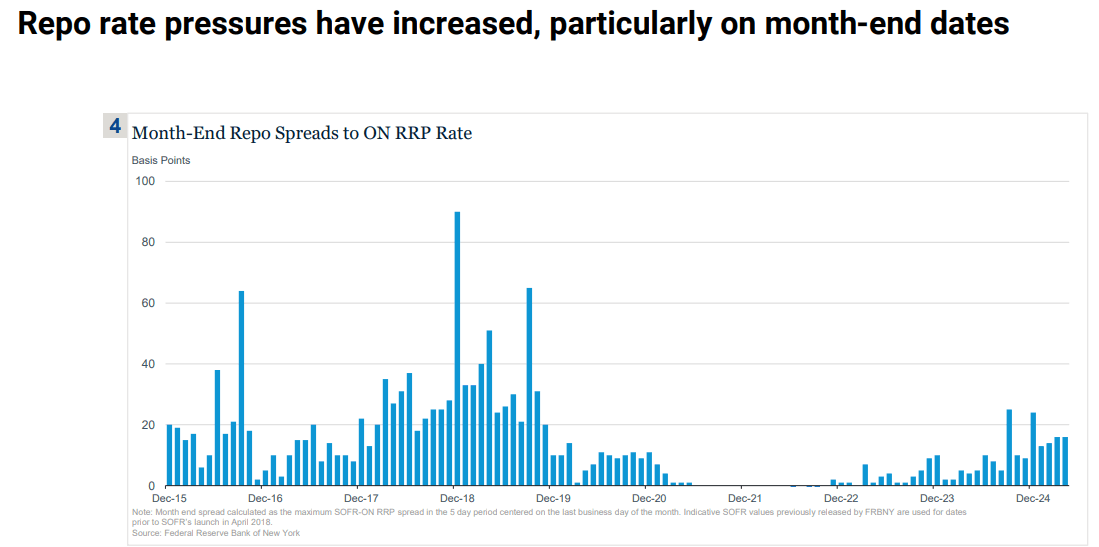
- "some details related to our implementation tools can make a difference to reserve demand" - the main one Perli cites is the standing repo facility (SRF) which is designed to cap upside in rates. "As the size of the Fed balance sheet continues to decline... and as reserves transition from abundant to ample levels, upward pressure on money market rates is likely to increase. We are starting to see the early signs of this in the repo market, especially around key reporting dates, following a period when the supply of reserves was so far in excess of demand that repo rates hardly moved at all. This represents a normalization of liquidity conditions and is not a cause for concern; however, it does imply that, in the future, the SRF is likely to be more important for rate control than it has been in the recent past."
- The emphasis on SRF is a running theme: Dallas Fed Pres Logan, who was Perli's predecessor as SOMA chief, this week continued to advocate for SRF (and discount window) enhancements.

Want to read more?
Find more articles and bullets on these widgets:
Historical bullets
US DATA: TGA Steadies Over $600B As Tax Receipts Continue To Roll In
The Treasury General Account rose $26B Friday and Monday, and at $626B is nearing the $639B recent high set post-April 15 tax day.
- April's tax receipts so far have been robust, toughly 20% above the cumulative amounts at this stage of the 2024 tax year, with the TGA up a similar amount vs a year prior.
- We reiterate that the ongoing tax take in this crucial month looks healthy enough to alleviate concerns that the x-date will be moved earlier rather than later.


CANADA DATA: Industrial Price Pressures Remain Elevated
Industrial product prices rose 0.5% M/M (NSA) in March, representing stronger price pressures than expected (0.3% survey, 0.6% prior upwardly revised by 0.2pp). While there was no consensus on the Y/Y rates, the index rose 4.7% on that basis, a slight pullback from 5.1% prior.
- The overall M/M story was of energy and petroleum products marking disinflationary progress (and Y/Y energy prices fell 4.9%), but were outweighed by several other commodity groups tha per StatCan "posted significant increases".
- In particular, non-ferrous metal product prices rose 3.8% M/M (led by aluminum/gold/silver), and lumber/wood products up 3.1% M/M (fastest since November 2024). These in turn reflected both market pressures (StatCan attributed the precious metals increase to "continued political instability fuelling safe-haven investment demand", with other products impacted by tariff uncertainty including for lumber and copper.
- Overall raw materials prices conversely fell 1.0% M/M (+0.1% survey, 0.3% prior, no revision), with the Y/Y rise of 3.9% showing continued disinflationary progress from 9.2% prior for a 4-month low - but still a fifth consecutive Y/Y rise.
- Raw materials ex-energy/petroleum product inflation remained elevated on a Y/Y basis but decelerated to 14.7% from 16.1% prior (which was a 34-month high).
- Overall, the broad measures of pipeline price pressures remain elevated. While IPPI looks to be topping out, core measures are mixed, with ex-energy remaining in the 6% area and raw materials ex-energy in double-digits. It's unclear to what degree this will pull back in April, with price developments since March being mixed (gold higher, copper and lumber softer, for example).


USDCAD TECHS: Trend Needle Points South
- RES 4: 1.4415 High Apr 1
- RES 3: 1.4296 High Apr 7
- RES 2: 1.4180 50-day EMA
- RES 1: 1.3906/4052 High Apr 17 / 20-day EMA
- PRICE: 1.3819 @ 16:21 BST Apr 22
- SUP 1: 1.3781 Low Apr 21
- SUP 2: 1.3744 76.4% retracement of Sep 25 ‘24 - Feb 3 bull run
- SUP 3: 1.3696 Low Oct 10 2024
- SUP 4: 1.3643 Low Oct 9 ‘24
A bearish theme in USDCAD remains intact for now. Fresh trend lows continue to highlight a resumption of the downtrend and signal scope for a continuation near-term. Potential is seen for a move towards 1.3744, a Fibonacci retracement. Moving average studies are in a bear-mode position, highlighting a dominant downtrend. First resistance to watch is 1.4052, the 20-day EMA.