US DATA: Solid July For PCE, But Consumption And Income Momentum Remain Tepid
July's Personal Income and Outlays report showed a modest uptick in income and spending on the month - however, the broader trends remain mixed at best. The bedrock of income, employee compensation, posted solid gains, but the overall trend in real disposable income growth remains soft. And despite an improvement in July, there is waning momentum in goods consumption after a strong tariff-front running boomlet earlier in the year, with services consumption not really gaining much traction either.
- Nominal personal income (a 3-month high 0.44% M/M after 0.29% ) and spending (0.53% after 0.37%) both had very marginal prior revisions and came in exactly in line with rounded expectations for July.
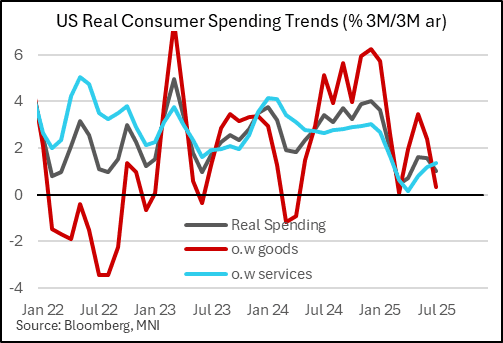
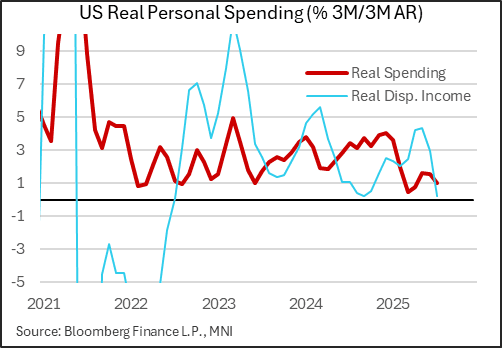
- Real spending growth printed 0.33% M/M growth after 0.08%, which when considering softer prints in the prior 3 months meant the quarterly pace of growth fell to 1.0% (3M/3M annualized) after an upwardly revised 1.6% in June (known from the second Q2 GDP reading out previously). That's the slowest pace in 3 months though Q3 is off on better footing than Q2 from a month-to-month perspective.
- The breakdown shows real goods spending rose 0.9% M/M, the fastest in 4 months after 3 consecutive contractions (June's was notably revised to slightly negative after 0.1% originally reported). This category is growing at a 0.3% quarterly rate, after rising above 6% at the turn of the year amid tariff-front running, and 2.4% in Q2 as a whole. Services consumption, which is twice as large as for goods, remained tepid, rising just 0.1% for the 4th consecutive month between 0.05-0.15%. Growth here however accelerated for the 3rd consecutive month on a 3M/3M annualized basis, up to 1.4% (1.2% prior), having seen contractions in Q1, leaving the 3M/3M rate at 0.2% at the trough in April. Of course, inflation - tariff or otherwise - may be playing a part here in keeping a lid on real growth.
- Going back to the income breakdown, this was pretty healthy: employee compensation drove the increase, rising 0.62% M/M, the fastest since November 2024, though the 3M/3M annualized rate slowed to a 9-month low 4.6%. After taxes though, total disposable income rose just 0.42% (0.29% prior). The discrepancy between the slowdown in employee compensation and the softer overall income is down to flat current transfer receipts in July, following significant volatility in previous months due to one-off Social Security payments.
- The bottom line is that real disposable income rose just 0.2% M/M, leaving it below April's level though that was unduly upped by the aforementioned government benefits. Though the 3M/3M rate dropped to a 10-month low 0.2%, the Y/Y rate rose to 2.0% from 1.7% the prior two months, suggesting a reasonably steady but hardly spectacular rate of growth (compare to the 4-6% growth rates in 2023).
- The household savings ratio remained unusually steady at 4.4% (has been 4.4% or 4.5% for 5 of the last 6 months).
Want to read more?
Find more articles and bullets on these widgets:
Historical bullets
EURIBOR: Basis trade
Euribor Basis trade:
- ERU5 4k at 98.01.
STIR FUTURES: BLOCK: Sep'25 SOFR Sale
- -10,000 SFRU5 95.835, post time bid at 0859:48ET, contract trades 95.835 last (-0.010).
AUDUSD TECHS: Clears The 20- And 50-day EMAs
- RES 4: 0.6700 76.4% retracement of the Sep 30 ‘24 - Apr 9 bear leg
- RES 3: 0.6688 High Nov 7 ‘24
- RES 2: 0.6677 0.764 proj of the Jun 23 - Jul 11 - 17 price swing
- RES 1: 0.6538/6625 High Jul 29 / 24 and the bull trigger
- PRICE: 0.6467 @ 14:05 BST Jul 30
- SUP 1: 0.6455 Low Jul 17
- SUP 2: 0.6373 Low Jun 23 and a bear trigger
- SUP 3: 0.6354 38.2% retracement of the Apr 9 - Jul 24 upleg
- SUP 4: 0.6323 Low Apr 16
AUDUSD has this week traded through both the 20- and 50-day EMAs. This undermines a recent bullish theme and signals the likely start of a corrective cycle. The next support to watch lies at 0.6455 the Jul 17 low. A clear break of this level would strengthen a bearish threat and signal scope for an extension towards 0.6373, the Jun 23 low. Key resistance has been defined at 0.6625 the Jul 24 high. It also represents the bull trigger.