ASIA STOCKS: SK/Taiwan Outflows Near Recent Extremes, Indonesia, Phils Supported
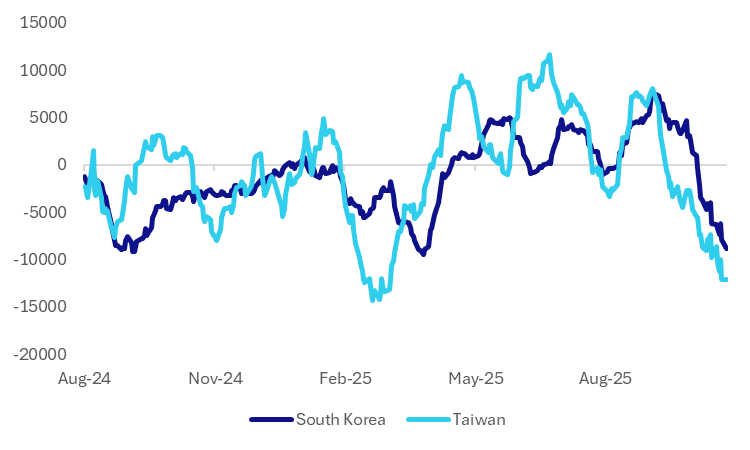
As we approach the end of November, offshore net selling continues for tech sensitive plays like South Korea and Taiwan. Even with signs of rebound momentum/stability in some of the related indices in Monday US trade, we are yet to see that stabilize outflows from these markets. Today, offshore investors have remained net sellers of local South Korean stocks (a further $67mn) per the NBUY function. Outflows have been strong for the past 5 trading days from both of these markets, see the table below. The chart below plots the rolling monthly net inflow trends, with both markets now back close to recent extremes in terms of outflow momentum (over $12bn for Taiwan, and near $9bn for South Korea).
- November to date has been better for the likes of Indonesia, India and the Philippines, which, at this stage, have positive month to date net inflows. Still, India's net inflows of $247mn are very modest compared to the scale of YTD outflows (still near -$16bn).
- Indonesia has likely benefited from less tech exposure and the government's pro-growth mindset. Some offshore dip buyers have emerged for Philippines stocks, but it is has been a consistent theme. The PCOMP is back above 6000, after testing under 5600 earlier in Nov (which was fresh multi year lows).
Table 1: Asian Markets Net Equity Flows
| Yesterday | Past 5 Trading Days | 2025 To Date | |
| South Korea (USDmn) | -569 | -3196 | -5898 |
| Taiwan (USDmn) | -902 | -5699 | -7106 |
| India (USDmn)* | -182 | 604 | -15952 |
| Indonesia (USDmn) | 190 | 381 | -1665 |
| Thailand (USDmn) | -35 | -196 | -3403 |
| Malaysia (USDmn) | -79 | -332 | -4622 |
| Philippines (USDmn) | -14 | 40 | -632 |
| Total (USDmn) | -1592 | -8398 | -39278 |
| * Data Up To Nov 21 |
Source: Bloomberg Finance L.P./MNI
Fig 1: Rolling 1 Month Sum - Net Inflows For South Korea and Taiwan (USD mn)
Source: Bloomberg Finance L.P./MNI
Want to read more?
Find more articles and bullets on these widgets:
Historical bullets
FED: MNI Fed Preview - October 2025: QT, Or Not QT
MNI's preview of the October FOMC has been published - Download Full Report Here
- The Federal Reserve is overwhelmingly expected to cut the funds rate by 25bp for a 2nd consecutive meeting on October 29, bringing the target range to 3.75-4.00%.
- This will again be framed as a risk management cut, with the limited data available since the September meeting not disconfirming that the shift in the balance of risks had tilted toward labor market downside.
- Dissent to this decision should once again be limited to Gov Miran in favor of a 50bp cut.
- With limited new developments and official data to opine on, Chair Powell’s press conference will be eyed for affirmation that a December cut remains on track, as signalled by the most recent Dot Plot.
- He’s unlikely to give much away, but it would be surprise given the lack of data and relevant developments if he suggested that a further 2025 cut was in any greater doubt than it was 6 weeks earlier.
- Instead, we think focus in terms of action at this meeting will be on the balance sheet, with the Fed likely to announce an end to quantitative tightening amid diminishing reserve levels and nascent evidence of funding market pressures.
- We will also be watching for any news on the Fed’s communications framework, with an updated “Dot Plot” potentially unveiled at some point by year-end.
MNI’s separate preview of sell-side analyst summaries to follow on Monday Oct 27
RATINGS: Moody's Lowers France's Outlook To Negative, Maintains Aa3 Rating
Moody's has lowered its outlook on France to negative from stable.
- Moody's was expected to at least lower the outlook, so this is not a surprise - there had been some risks perceived of a downgrade to A1 (from Aa3) in the domestic and foreign currency long-term issuer and domestic-currency senior unsecured ratings.
- Per the Moody's release: "The decision to change the outlook to negative reflects the increased risk that the fragmentation of the country's political landscape will continue to impair the functioning of France's legislative institutions. This political instability risks hampering the government's ability to address key policy challenges such as an elevated fiscal deficit, rising debt burden, and durable increase in borrowing costs, thus leading to a more rapid weakening in France's key fiscal metrics than we currently expect."
- Both S&P and Fitch have already downgraded France’s sovereign rating to the single-A bucket this year.
USDCAD TECHS: Corrective Pullback
- RES 4: 1.4200 Round number resistance
- RES 3: 1.4167 50.0% retracement of the Feb 3 - Jun 16 bear leg
- RES 2: 1.4111 High Apr 10
- RES 1: 1.4080 High Oct 16 and the bull trigger
- PRICE: 1.4016 @ 16:33 BST Oct 24
- SUP 1: 1.3979/3907 20- and 50-day EMA values
- SUP 2: 1.3829 Bull channel base drawn from the Jul 23 low
- SUP 3: 1.3769 Low Sep 19
- SUP 4: 1.3727 Low Aug 29 and a bear trigger
USDCAD has pulled back from its recent highs. The trend condition is bullish and a move lower is considered corrective. Moving average studies are in a bull-mode position, highlighting a dominant uptrend. Sights are on 1.4111, the Apr 10 high, and further out, scope is seen for an extension towards 1.4167, a Fibonacci retracement. First key support lies at 1.3907, the 50-day EMA. Support at the 20-day EMA lies at 1.3979.