US STOCKS: S&P(ESZ5) - Dips Toward 6850 Supported For Now
The S&P(ESZ5) overnight range was 6849.50 - 6909.50, SPX closed +0.17%, Asia is currently trading around 6878.00. The E-Mini’s continue to chop around sideways and seem to bounce pretty hard off the 6850 area for the third session in a row. This morning has seen stocks open slightly lower, E-minis(S&P) -0.05%, NQZ5 -0.10%. The market is clearly in a powerful uptrend, though there are signs of some short-term exhaustion but as of yet no pullback. Lots of chatter about the Fed needing to expand its balance sheet into year-end which could potentially add to short-term liquidity and keep the stock market supported. h/t - @LynAldenContact, Nothing stops this train.
- Andreas Steno Larsen believes “we are on the precipice of a broad-based positive surprise in the economy still”, see graph below showing how easy financial conditions are.
- Joseph Wang points out on X that the “Fed will need to expand its balance sheet by several hundred billion a year, and may start in December to head off year-end funding pressures. A structurally rising TGA and insatiable demand for repo financing leave them little choice.” This could add to short-term liquidity and ease financial conditions even more.
Fig 1: ISM Comp Vs Financial Conditions
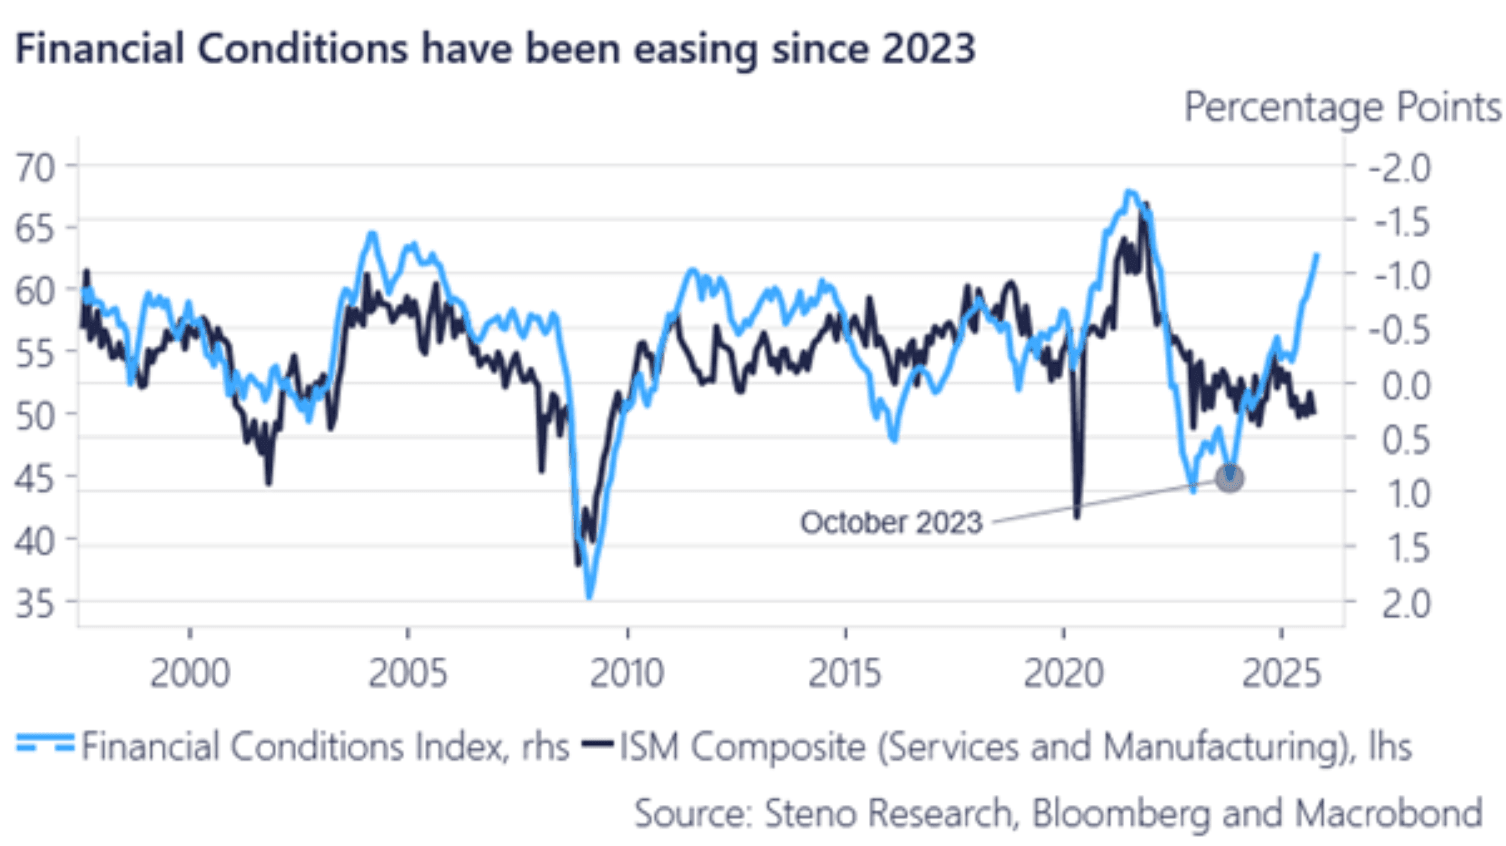
Source: MNI - Market News/Steno Research
Want to read more?
Find more articles and bullets on these widgets:
Historical bullets
USDCAD TECHS: Fresh Cycle High
- RES 4: 1.4111 High Apr 10
- RES 3: 1.4045 3.0% Upper Bollinger Band
- RES 2: 1.4019 38.2% retracement of the Feb 3 - Jun 16 bear leg
- RES 1: 1.3989 200-dma
- PRICE: 1.3953 @ 16:02 BST Oct 3
- SUP 1: 1.3897/3825 Low Sep 30 / 50-day EMA
- SUP 2: 1.3727 Low Aug 29 and a bear trigger
- SUP 3: 1.3689 Low Jul 28
- SUP 4: 1.3637 Low Jul 25
A bull cycle in USDCAD remains intact and yesterday’s break above the late September’s high, firms the bullish theme. This move higher also maintains the bullish price sequence of higher highs and higher lows. Note too that moving average studies are in a bull-mode position, highlighting a dominant uptrend. Sights are on 1.4019, a Fibonacci retracement point. On the downside, first key support lies at 1.3825, the 50-day EMA.
AUDUSD TECHS: Support Remains Intact For Now
- RES 4: 0.6763 1.382 proj of the Jun 23 - Jul 24 - Aug 21 price swing
- RES 3: 0.6726 1.236 proj of the Jun 23 - Jul 24 - Aug 21 price swing
- RES 2: 0.6660/6707 High Sep 18 / 17 and key resistance
- RES 1: 0.6629 High Sep 30 & Oct 01
- PRICE: 0.6603 @ 16:01 BST Oct 3
- SUP 1: 0.6527/21 61.8% of the Aug 21 - Sep 17 bull leg / Low Sep 26
- SUP 2: 0.6484 76.4% retracement of the Aug 21 - Sep 17 bull leg
- SUP 3: 0.6463/6415 Low Aug 27 / Low Aug 21 / 22 and a bear trigger
- SUP 4: 0.6373 Low Jun 23
The AUDUSD uptrend remains intact and recent weakness appears to have been a correction. Support to watch lies at the 50-day EMA, at 0.6558. A clear break of this average would signal scope for a deeper retracement and expose 0.6527 once again, a Fibonacci retracement. For bulls, a stronger reversal higher would refocus attention on 0.6707, the Sep 17 high. Initial resistance to watch is 0.6629, the Sep 30 and Oct 1 high.
US TSYS/SUPPLY: September's Coupon Auctions Were Generally Solid (2/2)
September’s coupon auctions were generally solid, with three lines trading through, two coming out on the screws and two tailing slightly.
- Looking through the lens of MNI’s Relative Strength Indicator (RSI), five lines saw positive readings while two saw negative readings.
- The 3-year sale was the strongest auction of the month according to MNI’s RSI. The 3-year line traded through 0.7bps, the largest stop through in seven months. Meanwhile, the primary dealer take-up was just 8.4%, the lowest on record (data going back to 2003).
- The weakest sale of the month was the last – the 7-year line. This line saw the second consecutive 0.5bp tail, with the 12.0% primary dealer take-up above August’s 9.8% and July’s record low 4.1%.
September Auction Review:
- 2Y Note on-the-screws: 3.571% vs. 3.571% WI.
- 2Y FRN: 0.200% high margin vs. 0.195% prior
- 3Y Note trade-through: 3.485% vs. 3.492% WI.
- 5Y Note tail: 3.710% vs 3.709% WI.
- 7Y Note tail: 3.953% vs. 3.948% WI.
- 10Y Note trade-through: 4.033% vs. 4.047% WI.
- 10Y TIPS: 1.734% high yield vs. 1.985% prior
- 20Y Bond trade-through: 4.613% vs 4.615% WI.
- 30Y Bond on-the-screws: 4.651% vs. 4.651% WI.
