EM CEEMEA CREDIT: ROMANI: new issue EUR & USD deals with FVs
Republic of Romania (ROMANI; Baa3/BBB-neg/BBB-neg)
New issue deals: EUR dual tranche and USD benchmark
IPT EUR 5Y @ ms+330bp area
IPT EUR long 9Y@ ms+420bp area
IPT USD 12Y @ T+325bp area
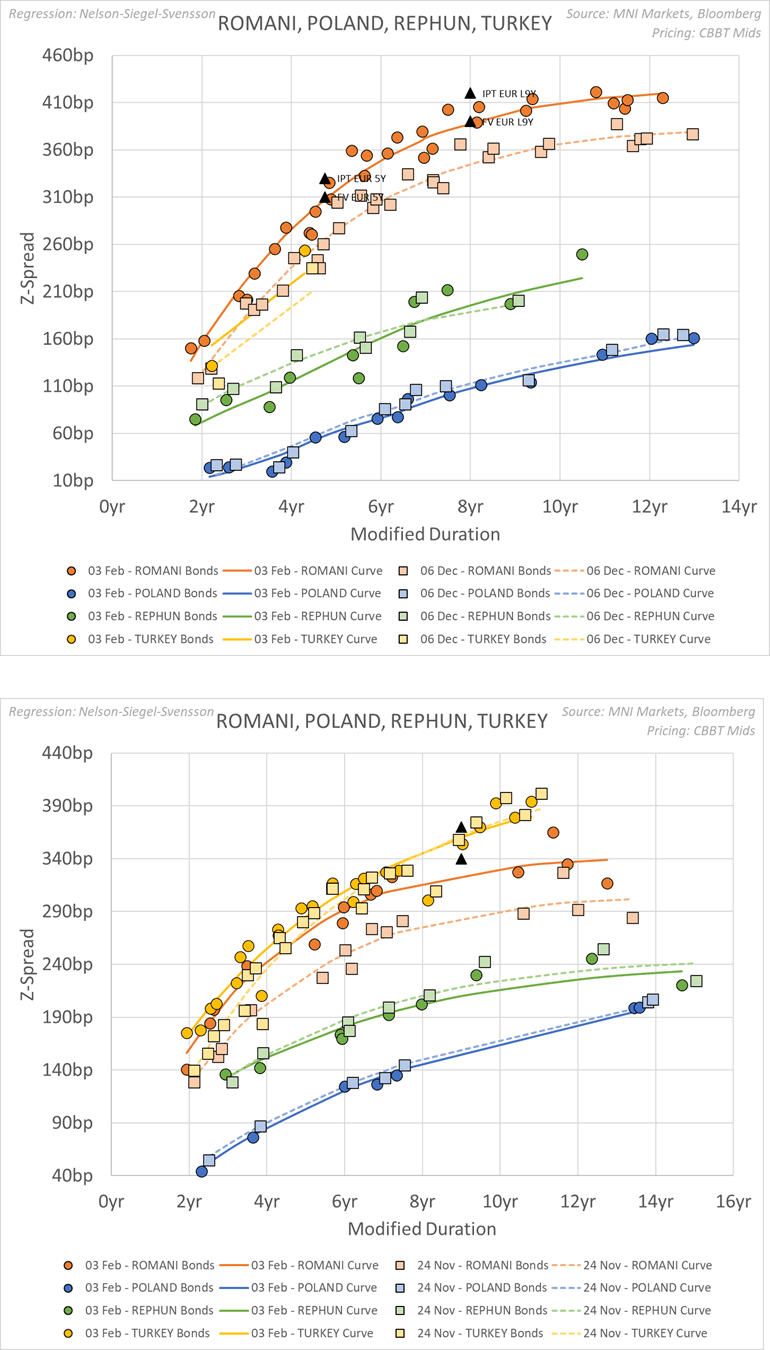
FV EUR 5Y @ z+310bp
FV EUR L9Y @ z+390bp
FV USD 12Y @ T+295bp
• We look at FV for two EUR denominated deals vs the theoretical, interpolated secondary EUR curve (see first chart below). We adjust theoretical by taking into account the two below factors and derive FV @ z+310bp and z+390b, respectively.
• Firstly, we note that the ROMANI curve has sold off on the back of political risk uncertainty since late November, following cancellation of the first round of general elections. This contrasts with the move tighter registered by peer sovereign curves over the same period. We think this makes the current secondary curve oversold.
• In contrast to the above, we note that Romania has plans to issue around EUR13bn in 2025, a reflection of its debt profile redemption wall. This offsets at least part of the political risk factor affecting overshooting if any.
• For the USD denominated deal, we look at the interpolated secondary USD curve (see second chart below). We apply similar rationale used for the EUR deals but we see FV at z+340bp or T+295bp, some 10bp of NIP above the theoretical, as we see the term structure looks compressed in the ultra-long end part of the curve.
Want to read more?
Find more articles and bullets on these widgets:
Historical bullets
JGB TECHS: (H5) Returns Lower
- RES 3: 149.55 - High Mar 22 (cont)
- RES 2: 147.74 - High Jan 15 and bull trigger (cont)
- RES 1: 144.48/146.53 - High Nov 11 / High Aug 6
- PRICE: 142.12 @ 15:01 GMT Jan 03
- SUP 1: 141.65 - Low Dec 30
- SUP 2: 141.56 - 1.764 proj of the Aug 6 - Sep 3 - 9 price swing
- SUP 3: 141.05 - 2.000 proj of the Aug 6 - Sep 3 - 9 price swing
Markets slipped on the hawkish Fed and are yet to fully recover, touching 141.65 on the way lower. Medium-term trend signals on the continuation chart continue to point south. A resumption of the trend would pave the way for a move towards 141.56, a Fibonacci projection point on the continuation chart. A stronger recovery would open 144.48, the Nov 11 high. Further out, key resistance is at 146.53, the Aug 6 high (cont).
USDCAD TECHS: Bull Flag Highlights A Clear Uptrend
- RES 4: 1.4669 2.0% 10-dma envelope
- RES 3: 1.4539 3.382 proj of the Oct 17 - Nov 1 - 6 price swing
- RES 2: 1.4508 3.236 proj of the Oct 17 - Nov 1 - 6 price swing
- RES 1: 1.4467 High Dec 19
- PRICE: 1.4392 @ 15:50 GMT Jan 3
- SUP 1: 1.4336 Low Dec 20
- SUP 2: 1.4307/4232 20-day EMA / Low Dec 17
- SUP 3: 1.4136 50-day EMA
- SUP 4: 1.4011 Low Dec 5
USDCAD is unchanged and bulls remain in the driver’s seat. The latest pause appears to be a flag formation - a bullish continuation signal. Note too that moving average studies are in a bull-mode position, highlighting a dominant uptrend. Sights are on 1.4508 next, a Fibonacci projection level. Initial firm support to watch lies at 1.4307, the 20-day EMA. A pullback would be considered corrective.
AUDUSD TECHS: Southbound
- RES 4: 0.6471 High Dec 9
- RES 3: 0.6408 50-day EMA
- RES 2: 0.6341 High Dec 18
- RES 1: 0.6247/6282 High Dec 30 / 20-day EMA
- PRICE: 0.6204 @ 15:21 GMT Jan 3
- SUP 1: 0.6179 Low Dec 31
- SUP 3: 0.6158 1.236 proj of the Sep 30 - Nov 6 - 7 price swing
- SUP 3: 0.6100 Round number support
- SUP 4: 0.6045 1.500 proj of the Sep 30 - Nov 6 - 7 price swing
A bearish trend condition in AUDUSD remains intact and the pair continues to trade closer to latest lows. Recent weakness maintains the price sequence of lower lows and lower highs. Note that moving average studies are in a bear-mode position too, highlighting a dominant downtrend. Scope is seen for an extension towards 0.6158 next, a Fibonacci projection. Initial firm resistance to monitor is 0.6282, the 20-day EMA.