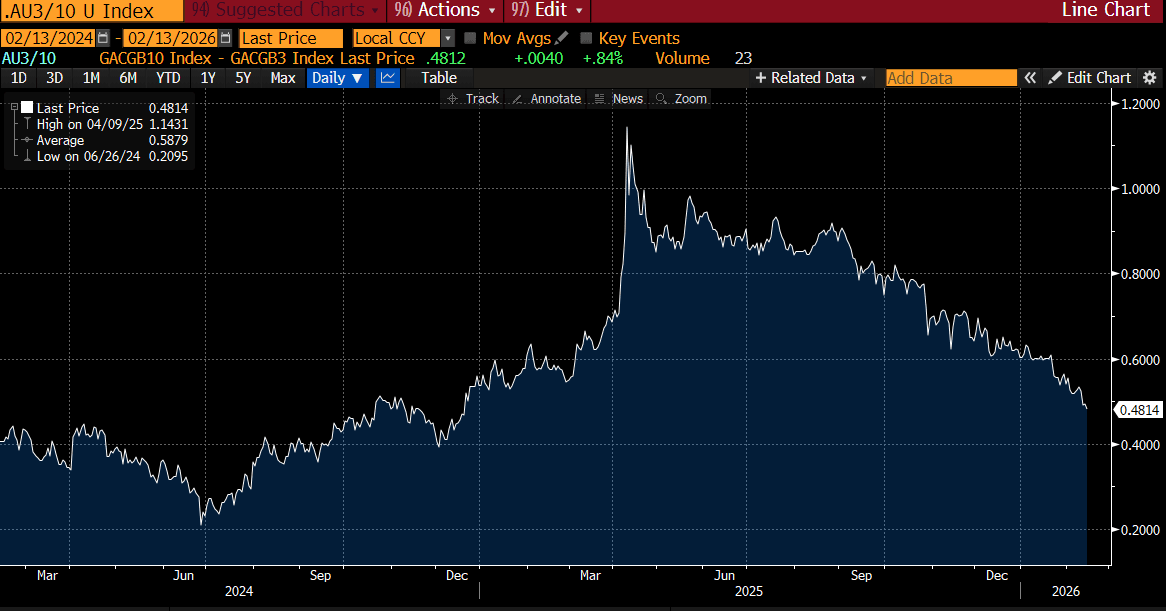
AUSSIE BONDS: Richer But Off Bests Ahead Of US CPI Data, Curve Flattens Further
ACGBs (YM +5.5 & XM +6.5) are stronger but off session bests.
- Cash US tsys are ~1bp cheaper in today's Asia-Pac session. Focus is on the release of US CPI data later today.
- “Angus Taylor faces a byelection test in the NSW seat of Farrer after wresting leadership from Sussan Ley. One Nation will run a "strong candidate" in Farrer, and other parties including the Liberals, Nationals, and teals are also expected to contest. Taylor was entrusted by colleagues to salvage the Liberal Party with a strong victory in Friday's leadership ballot, beating Ley by 34 votes to 17.” - BBG
- Cash ACGBs are 5-6bps richer with the AU-US 10-year yield differential at +64bps.
- Cash 3/10 curve flattens to lowest since end-2024.
- The bills strip has bull-flattened, with pricing flat to +4.
- RBA-dated OIS pricing shows tightening across all meetings, with the probability of a 25bp hike rising from 16% for March to 93% by June and 148% by December 2026.
- Tomorrow, the local calendar will be empty ahead of RBA Minutes of Feb. Policy Meeting on Tuesday.
- Next week, the AOFM plans to sell A$1200mn of the 4.25% 21 October 2036 bond on Wednesday and A$800mn of the 3.25% 21 April 2029 bond on Friday.
Bloomberg Finance LP
Want to read more?
Find more articles and bullets on these widgets:
Historical bullets
FOREX: USD-BBDXY Drifts Within 1205-1215 Range, Supreme Court Ruling To Come
The BBDXY has had a range today of 1211.17 - 1212.63 in the Asia-Pac session; it is currently trading around {BBDXY Index}. The USD largely ignored the softer CPI and drifted back up albeit within its range. On the day, it looks like more of the same while we trade within the 1205-1215 range, watch for any ruling from the Supreme court as well as a potential incursion into Iran to maybe provide a catalyst. This lack of a trend is being reflected in the CFTC data which shows very little positioning in the USD Index to start the year. A break above 1215-1216 could signal the potential for a deeper pullback.
- EUR/USD - Asian range 1.1636-1.1648, Asia is currently trading {EURUSD Curncy}. We are firmly back in the wider 1.1450-1.1850 range which dominated the last 6 months of the year and we need a catalyst to get a break and some sort of a trend going again. On the day, support is seen back toward the 1.1600-1.1620 area, a sustained break below 1.1600 could signal a deeper pullback may be on the cards.
- GBP/USD - Asian range 1.3420-1.3445, Asia is currently dealing around {GBPUSD Curncy}. The pair again topped out just below 1.3500 as the USD pushed back. On the day, watch to see if sellers can continue to keep the price below 1.3500, the bears need a break back below 1.3350/80 to signal a correction lower might be on the cards.
- Cross asset : SPX -0.10%, Gold $4625, US 10-Year 4.173%, BBDXY 1211, Crude Oil $60.94
- Data/Events : Italy General Government Debt
Fig 1: GBP/USD Spot Daily Chart
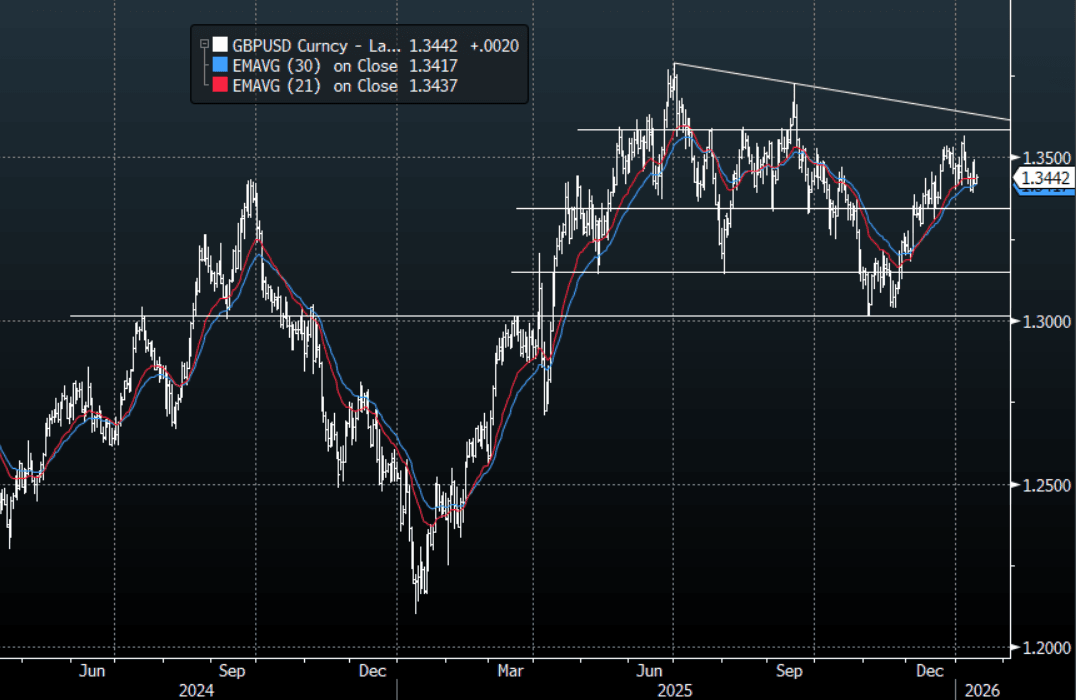
Source: MNI - Market News/Bloomberg Finance L.P
AUSSIE BONDS: Modestly Cheaper, Recent Narrowing In AU-US 10Y Diff Reverses
ACGBs (YM -1.0 & XM -2.0) are modestly weaker.
- Job vacancies were down -0.2%q/q (ending in Nov). Job vacancies remain around 30% off 2022 highs, but the trend though was only down modestly, to end Nov just under 327k.
- Cash US tsys are slightly richer, with a steepening bias, in today’s Asia-Pac session.
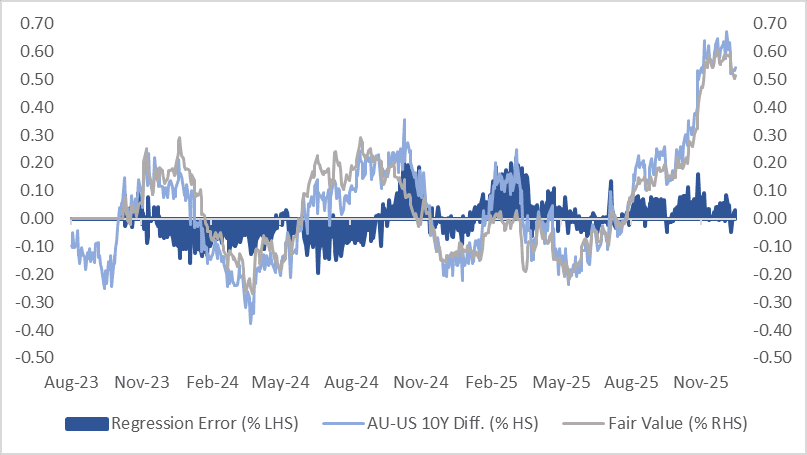
- Cash ACGBs are 1-2bps cheaper with the AU-US 10-year yield differential at at +55bps. A simple regression of the 10-year yield differential against the AU-US 1-year forward 3-month (1Y3M) swap spread over the past two years suggests the current spread sits 3bps above its regression-implied fair value.
- Today’s Oct-36 auction result extended the recent trend of firm pricing for ACGBs, with the weighted average yield printing 0.22bps through prevailing mids, according to Yieldbroker. However, demand was weaker, as reflected by a cover ratio of 3.1950x, down from the prior 3.7100x. The AOFM plans to sell A$700mn 3.25% 2029 bond on Friday.
- The bills strip is little changed.
- RBA-dated OIS pricing shows tightening across all meetings, with the probability of a 25bp hike rising from 30% for February to 90% by June and 144% by December 2026.
- Tomorrow, the local calendar will see Consumer Inflation Expectation data.
Bloomberg Finance LP
NZD: NZD/USD-Looking To Re-Establish Downward Momentum While Below 0.5800
The NZD/USD had a range today of 0.5731-0.5747 in the Asia-Pac session, it is currently trading around {NZD Curncy}. The NZD has drifted a little higher during our session as Asian stocks, Crypto and Metals outperform. The NZD has put in what looks like a top around 0.5850 and while this continues to cap I suspect the short-term could see bounces initially faded. On the day, the NZD bears will be feeling a little better, looking for sellers again back toward 0.5760-0.5780 as the shorts look for some momentum to build for a retest of the 0.5700 area.
- (Bloomberg) -- New Zealand’s home-building approvals rose 2.8% m/m in November versus a revised 0.7% decline in October, according to Statistics New Zealand.
- MNI AU - Filled Jobs Best M/M Rise Since Late 2023, But Still Down Y/Y: New Zealand filled jobs rose 0.3%m/m in Nov last year after a revised -0.1% outcome for Oct (originally reported as flat). Nov's rise was the best m/m gain since Oct 2023. This signifies some progress in better jobs growth momentum, although it follows a long period of softer momentum through much of 2024 and 2025. In y/y terms, jobs filled were still down 0.4%. The data, along with a rise in building permits, should add to the sense of improved economic momentum for NZ in 2026, suggesting an early wait and see approach for the RBNZ. Note we get Q4 2025 inflation next week on Friday.
- Options : Closest significant option expiries for NY cut, based on DTCC data: 0.5745(NZD349m). Upcoming Close Strikes : 0.5600(NZD351m Jan 16), 0.5800(NZD420m Jan 16) - BBG
- The NZD/USD Average True Range for the last 10 Trading days: 40 Points
Fig 1: NZD/USD Spot Daily Chart
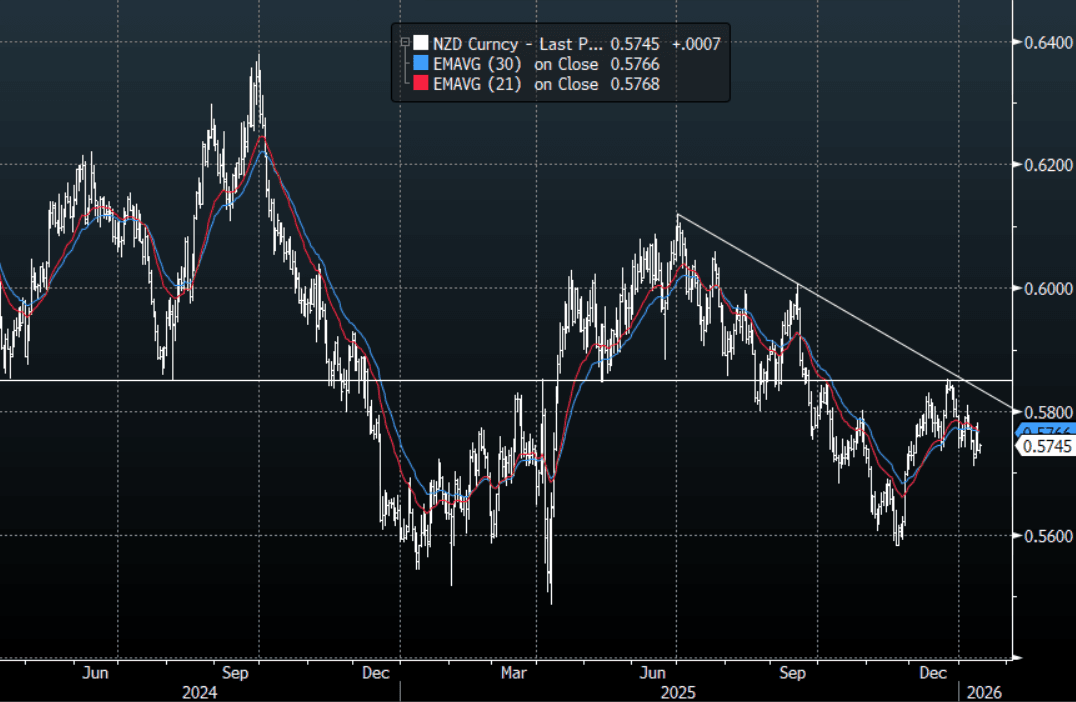
Source: MNI - Market News/Bloomberg Finance L.P