US DATA: Relative Stability In Jobless Claims Data After NFP Weakness
Aug-07 12:57
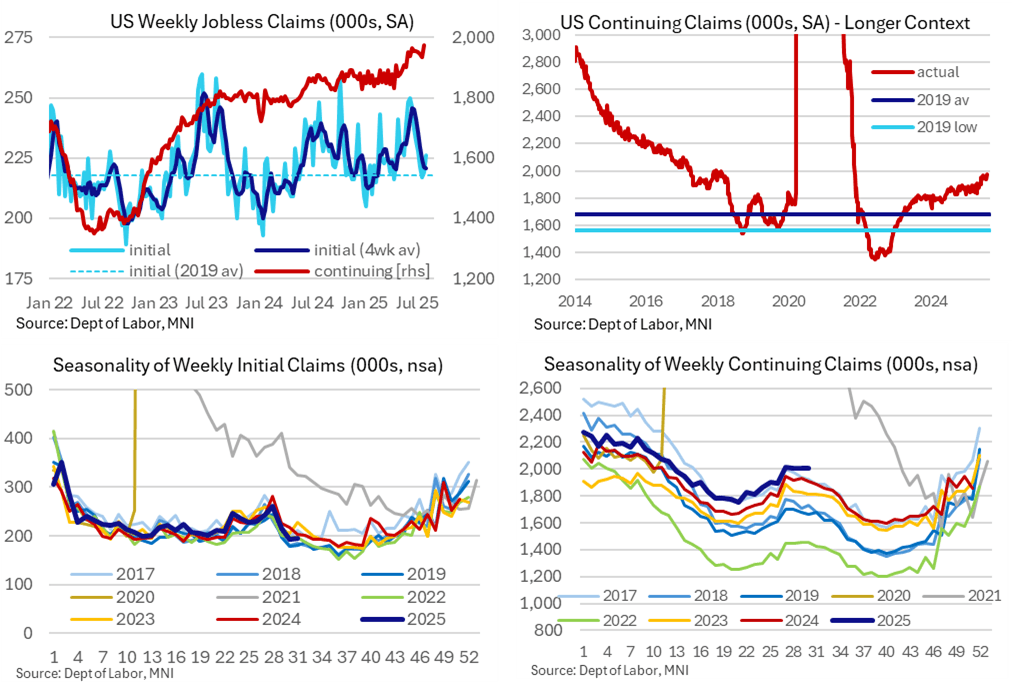
Jobless claims were a little higher than expected in latest weekly data. Neither are for a payrolls reference period but they nevertheless provide a sign of relative stability compared to the large downward revisions in last week’s July payrolls report. Initial claims remain close to periods of historical tightness whilst continuing claims saw a more notable push to fresh recent highs but could be due yet another downward revision.
- Initial jobless claims 226k (sa, cons 222k) in the week to Aug 2 after a marginally upward revised 219k (initial 218k)
- The four-week average was unchanged at 221k, still very close to the 218k averaged in 2019 for a comparison with previous labor market tightness.
- Continuing claims 1974k (sa, cons 1950k) in the week to Jul 26 after a downward revised 1936k (initial 1946k). It came about from no sign of a tick lower in non-seasonally adjusted claims.
- That’s a new recent high for seasonally adjusted continuing claims (last higher late 2021) but they have recently had a habit of being revised lower – surprisingly, we count at least the past fifteen releases to have been revised lower.
- That could easily see it more consistent with what is previously seen to have been the cycle high of 1964k in mid-June.
- As for the claims rate, the recent increase in covered employment means that the 1.29% rate in latest data ties with the 1.29% from mid-June for recent highs.
- Taking a step back with a historical comparison, initial claims are close to the 2019 average of 218k (when the unemployment rate averaged 3.67%) whilst continuing claims are close to the 2017 average of 1957k (when the u/e rate averaged 4.36%). For context, the latest u/e rate stood at 4.25% in July after Friday’s weak payrolls report but remains close to the 4.15% averaged for over a year now.
Want to read more?
Find more articles and bullets on these widgets:
Historical bullets
MNI: US REDBOOK: JUL STORE SALES +5.1% V YR AGO MO
Jul-08 12:55
- MNI: US REDBOOK: JUL STORE SALES +5.1% V YR AGO MO
- US REDBOOK: STORE SALES +5.9% WK ENDED JUL 05 V YR AGO WK
US TSY FLOWS: Another round of selling goes through at the lows
Jul-08 12:50
- Some of the relief bounce in EGBs with the earlier supply out of the way are still limited.
- Bund is ticking back lower, this is led by a round of selling in Treasuries, albeit in limited volumes, TYA in 5k, FVA 3.7k, TUA 3k.
- The next level in the US 10yr Yield is at 4.45% = 110.18+.
- USDJPY is through another intraday high on the follow, and looking to challenge the immediate resistance right here at 146.77 76.4% retracement of the Jun 23 - Jul 1 bear leg.
FED FUNDS FUTURES: Aug'25 FF Buy
Jul-08 12:47
- +10,000 FFQ5 95.685 (+0.00), still offered
Trending Top
Jun-25 06:23