EM CEEMEA CREDIT: QTELQD: 1Q25 results, neutral for credit
May-01 13:42
Ooredoo (QTELQD; A2/A/-)
1Q25 results, neutral for credit
- Qatar’s telecom champion Ooreedoo released Q1 results aft-mkt hours y’day. Net profits show small up at QAR960mn, +5% YoY on flat YoY rev’s at QAR5.85bn (FY25 guidance range at 2% to 3% growth). EBITDA at QAR2.53bn supported by growth across geographies (Kuwait on mobile services, Algeria on data and digital and Iraq on customer numbers as reported by Co.), with margin stable YoY at 43%, in line with affirmed guidance. Increase in capex (+41% YoY at QAR538mn, on higher investments across Iraq, Oman, Kuwait, Algeria and Tunisia) has small impact on FCF, -8% YoY at QAR2bn. FY25 capex guidance stands at QAR 4.5bn to 5.0bn.
- Reported TTM leverage at 0.6x sits below guidance (1.5x-2.5x range). Liquidity remains strong with QAR5.4bn UF and CCE QAR13.4bn.
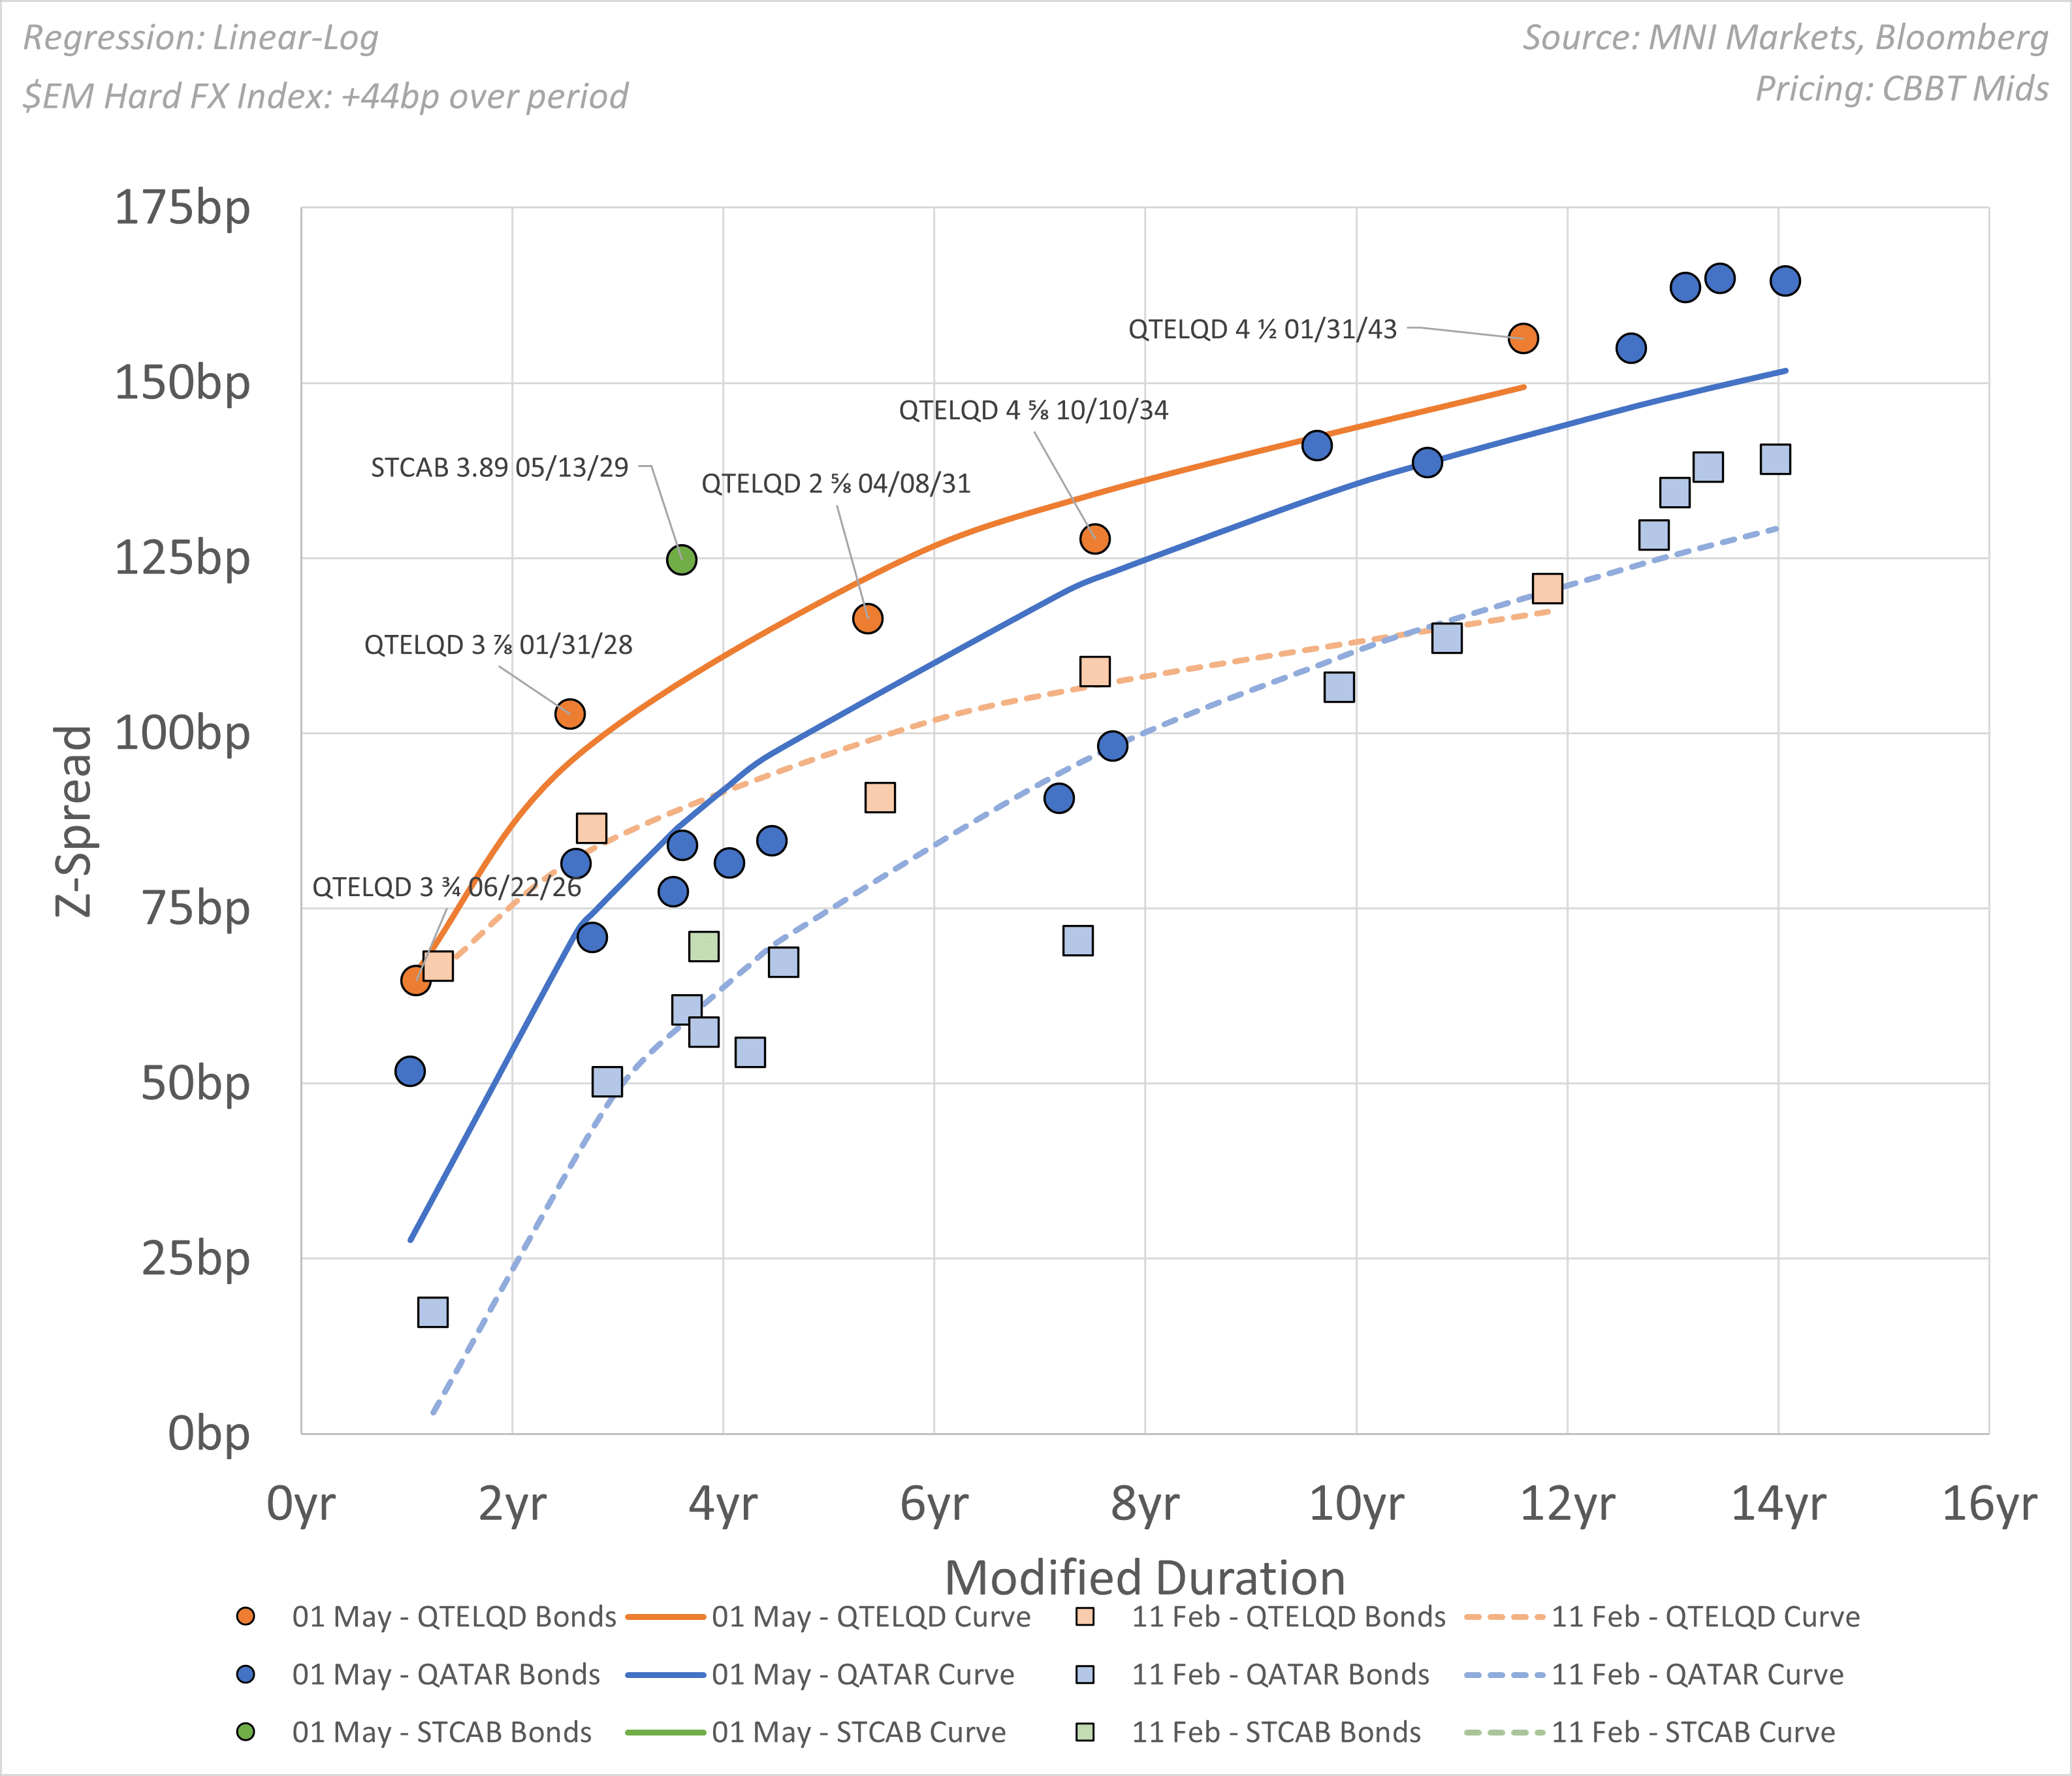
- For context, when looking at spread moves since FY24 results were reported, we see QTELQD 4.625 Oct34 benchmark bond charting at z+128bp, +19bp. The move wider is consistent with the moves seen across the sovereign curve (eg QATAR 34s +20bp). Among peers, Saudi Arabia’s Saudi Telecom 29s charting at z+125bp have widened by +55bp over the same period (see chart below).
Want to read more?
Find more articles and bullets on these widgets:
Historical bullets
EQUITY TECHS: E-MINI S&P: (M5) Key Support Remains Exposed
Apr-01 13:39
- RES 4: 5886.86 50-day EMA
- RES 3: 5837.25 High Mar 25 and a key resistance
- RES 2: 5766.74 20-day EMA
- RES 1: 5672.75 High Mar 31
- PRICE: 5640.50 @ 14:28 BST Apr 1
- SUP 1: 5559.75/33.75 Low Mar 13 and the bear trigger / Low Mar 31
- SUP 2: 5500.00 Round number support
- SUP 3: 5483.50 2.00 proj of the Dec 6 ‘24 - Jan 13 - Feb 19 swing
- SUP 4: 5396.00 2.236 proj of the Dec 6 ‘24 - Jan 13 - Feb 19 swing
S&P E-Minis maintain a softer tone following recent bearish price action. Attention is on key support and the bear trigger at 5559.75, the Mar 13 low. It has been pierced, a clear break of it would confirm a resumption of the downtrend that started Feb 19, and open 5483.30, a Fibonacci projection. MA studies are in a bear-mode position, highlighting a dominant downtrend. Key short-term resistance has been defined at 5837.25, the Mar 25 high
EQUITIES: US Cash opening calls
Apr-01 13:25
SPX: 5,606.9 (-0.1%); DJIA: 41,899 (-0.2%/-103pts); NDX: 19,258.1 (-0.1%).
EUROPEAN INFLATION: SA Data Suggests Elevated Pace Despite NSA Deceleration
Apr-01 13:15
Sequentially, SA services prices rose 0.27% M/M - almost in line with the 0.29% M/M average seen since December.
- In annualized terms, this would mean a current services pace of around 3.5%. Although annual NSA services inflation was slightly weaker-than-expected at 3.42% Y/Y (vs 3.5% MNI consensus, 3.68% prior), the seasonally adjusted data suggests that underlying price pressures still remain elevated.
- Eurozone services inflation momentum rose to 3.23% on a 3m/3m seasonally adjusted and annualised basis (using ECB data), the second consecutive increase after an eight-month streak of decelerations - underscoring questions some analysts had raised before on residual seasonality in the data. Momentum rose last Spring, too.
- For hawkish ECB policymakers (nowadays led by Executive Board member Schnabel), this development will underscore the need for a more cautious approach to policy further ahead - especially if the governing council goes ahead with an April cut, as appears to be markets' base case as of now.
- Non-energy industrial goods momentum ticked up to 0.75% (vs 0.68% prior), with sequential prices flat M/M (vs 0.12% prior).
- Taken together, this left core inflation momentum at 2.34% (vs 2.22% Feb, 1.85% Jan).
