EU REAL ESTATE: Property: Week in Review
* Public Property Invest has recently taken over the community sector assets of SBB in a transform...
Want to read more?
Find more articles and bullets on these widgets:
Historical bullets
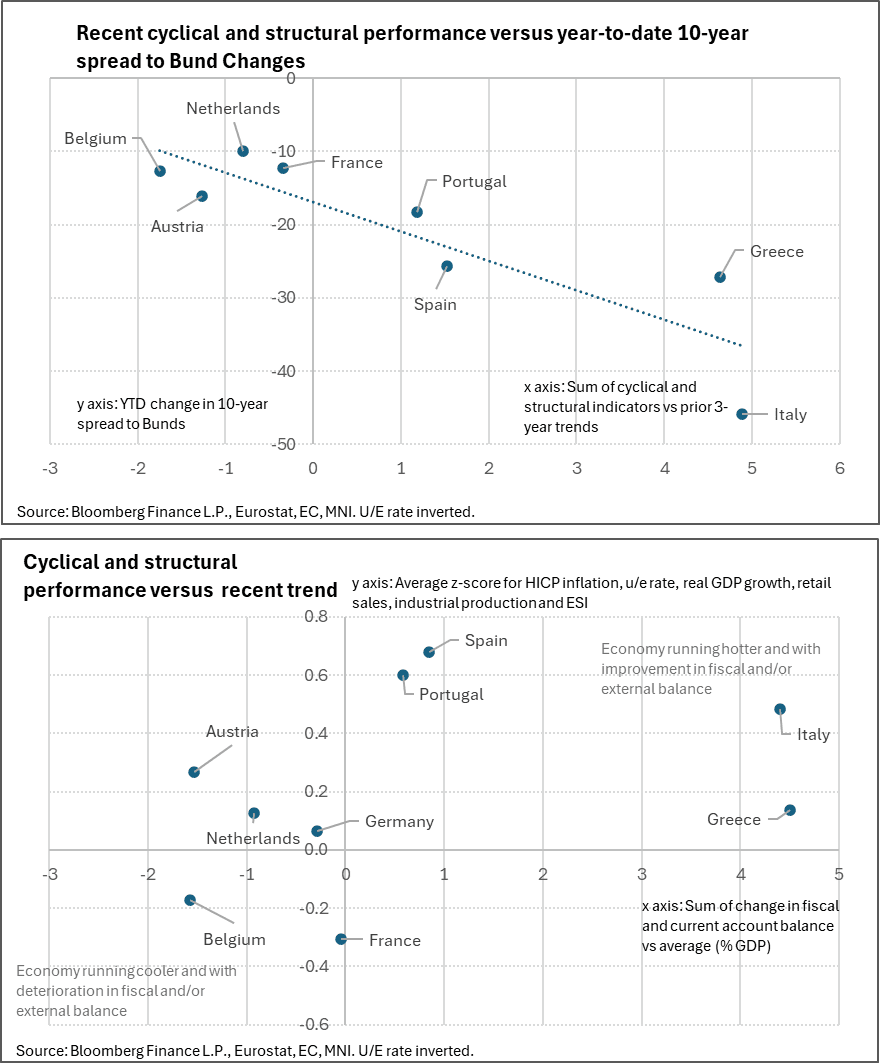
EUROZONE DATA: YTD BTP Narrowing May Have Outstripped Fundamentals
In the scatter chart below, we plot the sum of our simple cyclical and structural indicators against the year-to-date change in 10-year spreads to Bunds. The negative correlation is in line with what you’d expect – improved growth tends to promote domestic EGB outperformance versus Bunds, but less so if it comes at the cost of fiscal resilience.
- The chart suggests this year’s ~45bp narrowing in the BTP/Bund spread has outstripped economic fundamentals. While this doesn’t mean a reversal of recent tightening is warranted, it may raise the bar to continued BTP outperformance next year.
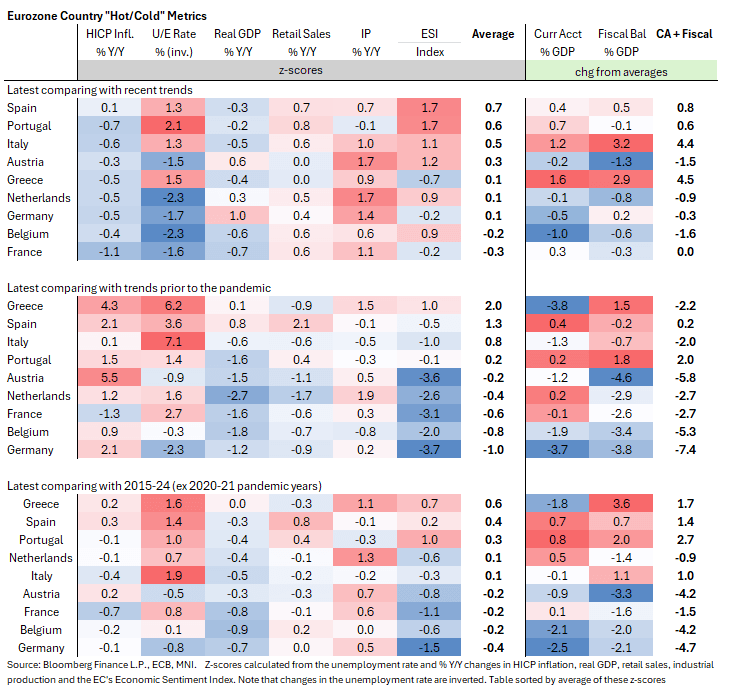
EUROZONE DATA: Southern Europe Still The Cyclical and Structural Outperformer
Ahead of tomorrow’s ECB decision, we refresh our heatmaps on cyclical and structural economic performance across the largest Eurozone economies. The overarching conclusion is that Southern European countries continue to outperform from a cyclical perspective.
- Relative to our last update in August, France and Belgium have moved to the bottom of the leaderboard when comparing latest cyclical indicators against the previous three year’s trends. This may reflect persistent political uncertainty seen in both countries since the summer.
- That means Germany is now only the third-lowest country on the “recent trend” leaderboard (it was at the bottom in August). However, current cyclical performance is still notably weak on a longer-term comparison. The anticipated ramp-up in domestic fiscal spending is expected to provide a growth impulse from next year, but today’s poor December IFO survey highlights that sentiment remains sluggish.
- From a structural perspective, well-documented improvements in Italy and Greece’s fiscal balances are evident. Meanwhile, we note that Austria’s modest cyclical improvements have come alongside a deterioration in the current account surplus (although data only available through Q2) and the fiscal deficit.
- The table below takes the average z-score for HICP inflation, the u/e rate (with an inverse sign), real GDP, retail sales, IP growth and the EC’s Economic Sentiment Index calculated with latest values vs the most recent three years, the three years prior to the pandemic and then a longer sample of the last ten years excluding 2020-21 pandemic-driven distortions. We then also compare fiscal and current account balances as % GDP over the same periods.
SOFR OPTIONS: BLOCK: Feb'26 SOFR Midcurve Put Condor
- 2,500 0QG6 96.68/96.81/96.87/96.93 put condors ref 96.87 at 0715:43ET