EUROPEAN INFLATION: PPI ex-Energy Moderates But With Mixed Drivers
Eurozone PPI inflation was as expected in June on a Y/Y basis at 0.6% after 0.3% in May, despite a small miss for the M/M at 0.8% (cons 0.9) after -0.6% M/M - all NSA data.
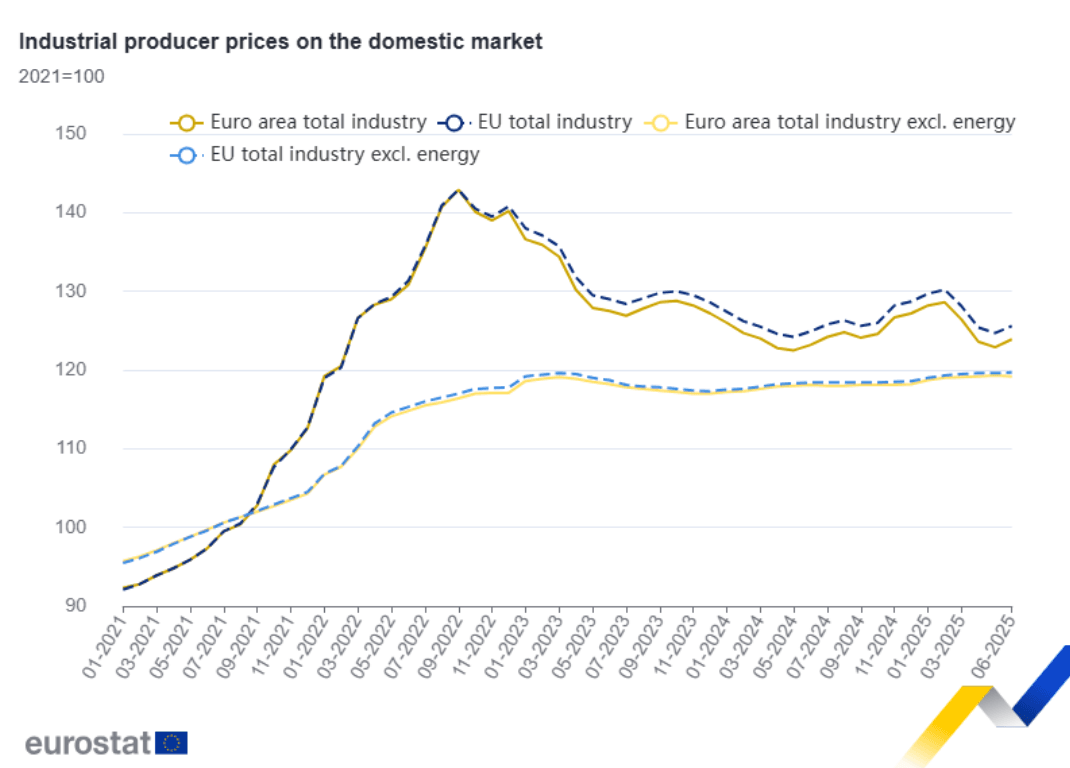
- Energy PPI deflation slowed from -1.5% in May to -0.1% Y/Y (highest since March) amid a firm 3.2% M/M jump in the category.
- PPI ex-energy inflation meanwhile eased from 1.1% to 0.9% Y/Y for the lowest rate since November.
- Across the non-energy categories, Y/Y rates were mixed vs May: Non-durable consumer goods at 2.0% (1.9% May), durable consumer goods at 1.5% (1.4% May), and capital goods stayed put at 1.7%. Intermediate goods meanwhile moved into negative territory, at -0.1% Y/Y (0.2% May) for the first time since last November (at least before potential revisions to the data).
- Whilst there recently appears to be only limited impact of disinflationary effects from potential Chinese goods re-routing to Europe under Trump administration trade policy, the further moderation in intermediate goods inflation is worth watching. That said, whilst small parcel taxes have been considered in some countries such as France as a possible anti-dumping measure, we note that industrial prices of consumer goods are still growing more solidly.
Want to read more?
Find more articles and bullets on these widgets:
Historical bullets
USDCAD TECHS: Trend Outlook Remains Bearish
- RES 4: 1.4111 High Apr 4
- RES 3: 1.4016 High May 12 and 13 and a key resistance
- RES 2: 1.3920 High May 21
- RES 1: 1.3674/3776 20- and 50-day EMA values
- PRICE: 1.3607 @ 16:12 BST Jul 4
- SUP 1: 1.3557 Low Jul 03
- SUP 2: 1.3540 Low Jun 16 and the bear trigger
- SUP 3: 1.3503 1.618 proj of the Feb 3 - 14 - Mar 4 price swing
- SUP 4: 1.3473 Low Oct 2 2024
The trend needle in USDCAD points south and this week’s move down reinforces current conditions. S/T gains between Jun 16 - 23 appear to have been corrective. Key support and the bear trigger is 1.3540, Jun 16 low. Clearance of this level would resume the downtrend and open 1.3503, a Fibonacci projection. Pivot resistance is at the 50-day EMA, at 1.3776. A clear break of this average would signal scope for a stronger recovery.
AUDUSD TECHS: Bull Cycle Remains In Play
- RES 4: 0.6700 76.4% retracement of the Sep 30 ‘24 - Apr 9 bear leg
- RES 3: 0.6688 High Nov 7 ‘24
- RES 2: 0.6603 High Nov 11 ‘24
- RES 1: 0.6590 High Jul 01
- PRICE: 0.6548 @ 16:05 BST Jul 04
- SUP 1: 0.6521 20-day EMA
- SUP 2: 0.6468/6373 50-day EMA / Low Jun 23 and a reversal trigger
- SUP 3: 0.6357 Low May 12
- SUP 4: 0.6275 Low Apr 14
The trend set-up in AUDUSD remains bullish and the pair is holding on to its recent gains. The latest break higher maintains the bullish price sequence of higher highs and higher lows, the definition of an uptrend. Moving average studies are in a bull-mode position, highlighting a dominant uptrend. Sights are on 0.6603 next, the Nov 11 2024 high. Key short-term support has been defined at 0.6373, the Jun 23 low.
EURJPY TECHS: Northbound
- RES 4: 171.88 High Jul 19 ‘24
- RES 3: 171.28 1.382 proj of the Feb 28 - Mar 18 - Apr 7 price swing
- RES 2: 171.09 High Jul 23 ‘24
- RES 1: 170.61 High Jul 03
- PRICE: 170.22 @ 16:04 BST Jul 04
- SUP 1: 169.04 Low Jul 02
- SUP 2: 167.87 20-day EMA
- SUP 3: 167.13 Low Jun 20
- SUP 4: 165.66 50-day EMA
EURJPY traded higher on Thursday resulting in a print above 170.47, the 76.4% retracement of the Jul 11 - Aug 5 sell-off. A clear break of this price point would strengthen bullish conditions and signal scope for extension. This would open 170.28 next, a Fibonacci projection. The trend is overbought, a pullback would unwind this condition. Support to watch lies at 167.87, the 20-day EMA.