US DATA: PCE Inflation Exceeds Fed Tracking, Extends Stabilization Above Target
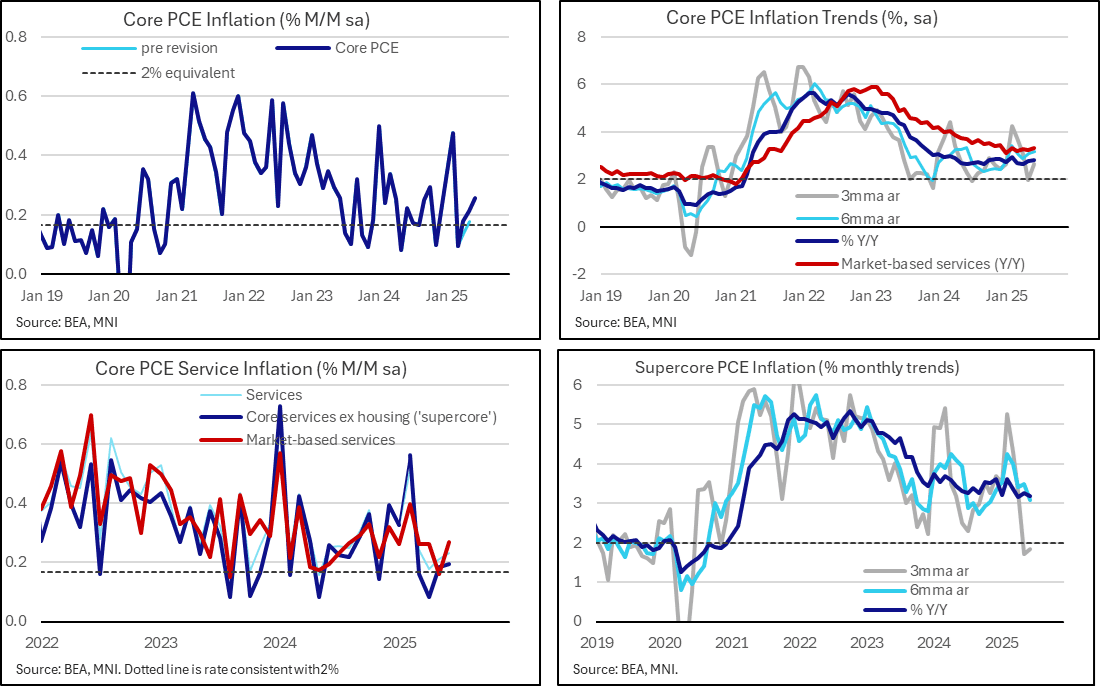
Both headline and core PCE inflation were stronger than Fed tracking in June, at least going off Fed Chair Powell’s comments in yesterday’s FOMC press conference, although don’t look too surprising considering an upward surprise in yesterday’s Q2 advance release. It continues trend stabilization in core PCE inflation comfortably above the 2% inflation target, most recently at 2.8% Y/Y, whilst market-based services inflation (a component of interest for the more hawkish members) is still at 3.3% Y/Y.
- Core PCE inflation was softer than analyst unrounded estimates had been tracking in June, at 0.26% M/M (we had seen estimates averaging 0.28% after CPI, PPI and import price inputs) but with larger revisions earlier in Q2 more than offsetting (with April +4bp and May +3bp).
- Those revisions meant the 0.26% M/M followed 0.21% in May and 0.18% in April, having previously been more consistent with 2% annualized inflation.
- As flagged though, this net upward revision was known after yesterday’s Q2 advance release.
- Interestingly, both headline PCE (2.58% Y/Y) and core PCE (2.79% Y/Y) were stronger than the 2.5% and 2.7% Y/Y that Fed Chair Powell pointed to in yesterday’s FOMC presser when citing CPI and other inputs, despite the Q2 advance release coming much earlier that day.
- After impressive disinflationary progress from late 2022 to early 2024, the Y/Y rate has averaged 2.75% since Apr 2024.
- Recent run rates for core PCE inflation are mixed when it comes to interpretating momentum around the latest 2.8% Y/Y rate, with a three-month rate tracking at 2.6% annualized and six-month at 3.2%.
- As for some key sub-components, core services ex-housing came in at 0.193% M/M for little change from the upward revised 0.184% M/M in May (previously 0.129%). This measure is running hotter than core PCE in Y/Y terms at 3.19% Y/Y but both three- and six-month rates are softer at 1.9% and 3.1% annualized.
- Whilst that may offer some comfort to the Fed, market-based services are stickier, at 3.3% Y/Y or 2.8% annualized over three months and 3.3% over six months.
Want to read more?
Find more articles and bullets on these widgets:
Historical bullets
US DATA: Redbook Retail Sales Growth Remains Steady Amid Weakness In Other Data
Johnson Redbook retail sales posted a 4.9% Y/Y rise in the week to Jun 28, accelerating from 4.5% the week prior and bringing the month-to-date sales increase to 4.9% Y/Y (up from the prior week's MTD of 4.8% but on the light side compared to retailers' targeted 5.7%). Technically, June is a 5-week retail month which ends July 5.
- The anecdotes of the report are largely upbeat, pointing to both rising activity in the week alongside discounting and some anticipation of Amazon Prime Day: "The Fourth of July holiday promotions, combined with summer heat waves and the demand for seasonal goods, have led to an increase in customer traffic and sales for the week. Many stores now display summer clearance items alongside fall merchandise. Since this year's July 4th falls on a Friday, many retailers are responding by offering sales promotions that extend from the weekend before to the weekend following Independence Day. Shoppers are stocking up on food and beverages in anticipation of the holiday. Meanwhile, retailers are preparing to compete with Amazon's Prime Day sales, scheduled for July 8th to 11th."
- Amid some weakness seen in recent consumer data, including a downward revision to Q1 private consumption and May's PCE, Johnson Redbook sales' resilience casts a slightly more positive light on the consumer though there's clearly been a slowdown in this series since April's 6.7% Y/Y post-2022 high (likely influenced to some degree by pulling forward purchases ahead of tariffs).
- June's Census Bureau retail sales report (Jun 17) will be eyed for improvement (was a soft 3.3% Y/Y), especially in ex-auto sales (-0.3% M/M in May), albeit the Control Group sales were solid at +0.4% M/M.

BUND TECHS: (U5) Recovered From Monday’s Low
- RES 4: 132.42 2.000 proj of the May 14 - 20 - 22 price swing
- RES 3: 132.00 Round number resistance
- RES 2: 131.95 High Jun 13 and the bull trigger
- RES 1: 130.73/131.33 Intraday high / High Jun 20
- PRICE: 130.63 @ 13:34 BST Jul 1
- SUP 1: 130.00 Low Jun 30
- SUP 2: 129.67 76.4% retracement of the May 14 - Jun 13 bull leg
- SUP 3: 129.30 Low May 22
- SUP 4: 128.97 Low May 14 and a reversal trigger
Recent weakness in Bund futures resulted in a print below key short-term support at 130.12, the Jun 5 low. A clear break of this price point would highlight a bearish threat, undermine the recent bullish theme, and signal scope for an extension towards 129.30, the May 22 low. The contract has recovered from yesterday’s low. Key resistance has been defined at 131.95, the Jun 13 high. Clearance of this level would reinstate a bullish theme.
CROSS ASSET: Selling Orders are emerging in Treasuries
- Some order flow are hitting the Treasuries, but nothing big, TYU5 is sold in 4k, FVA 3k, USA 1k.
- US Emini is seeing some small momentum selling, now targets Yesterday's low at 6223.25, which is also Yesterday's Open.
- This is helping the USDJPY back at the 143.00 figure, but all within ranges across multi Assets.