EM LATAM CREDIT: Pan American Energy: FV $ 11Y Priced
(PANAME; B1/NR/BB-pos) Priced: $375mn 7.9% IPTs: Low 8% Area FV: 7.625% * Please see our earlier...
Want to read more?
Find more articles and bullets on these widgets:
Historical bullets
US OUTLOOK/OPINION: Macro Since Last FOMC - Inflation: Likely Softer Than F'cast
- The Fed has the least clarity on inflationary pressures, with very little official data to further the FOMC’s understanding since the late October meeting. It had already seen the September CPI report after the BLS made an exception and released it on Oct 24 during the government shutdown on social security payment grounds.
- Since then, all we’ve seen are PPI and PCE reports for September which saw slightly more dovish outcomes compared to post-CPI tracking. The November CPI report will be published on Dec 18 whilst the October release has been cancelled save a few details for non-survey-based variables.
- Core PPI inflation was softer than expected back in September and broadly chimes with underlying core goods CPI inflation, with a peak for post-tariff M/M inflation pressures having come earlier in the summer (June for our median estimate on the CPI side, July for core PPI).
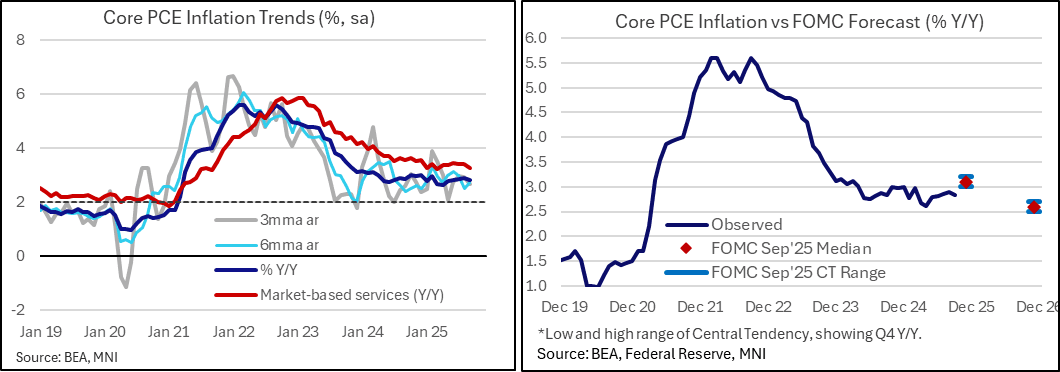
- Core PCE inflation meanwhile came in on the soft side of already trimmed expectations at 0.20% M/M after 0.22% in Aug and an average 0.24% through May-Jul, with the peak monthly rate for the post-tariff period being 0.26% M/M back in June. Higher monthly core goods inflation was offset by softer core services. It saw core PCE inflation ease to 2.83% Y/Y after the 2.90% in August was its highest since February, and more recent run rates eye some further moderation with both the three- and six-month averages at 2.7% annualized.
- With services an area of increased concern recently in previous signs of tariff spillover, we note that market-based services inflation eased to 3.2% Y/Y after five consecutive months at 3.4%. Highlighting its still elevated nature, this series averaged 2.2% in 2017-19.
- Core inflation therefore is still stubbornly above the 2% inflation target but it still looks increasingly likely we'll see downward revisions to the FOMC median core PCE forecast of 3.1% Y/Y in 4Q25 with next week’s SEP.
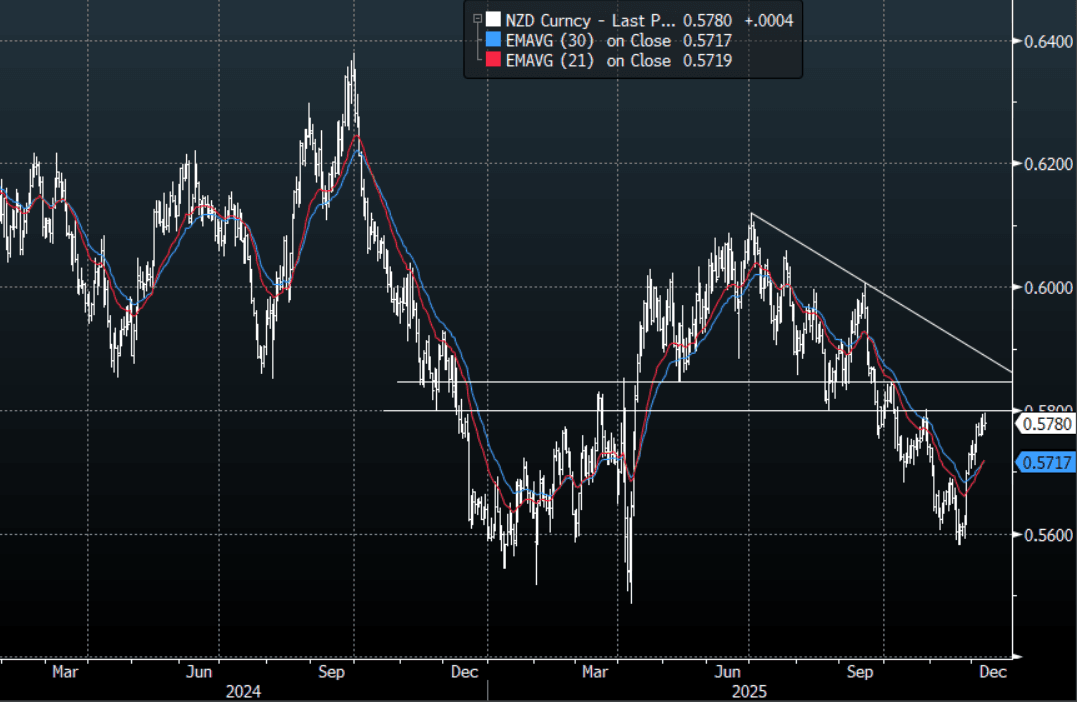
NZD: NZD/USD - Stalling Towards 0.5800
The NZD/USD had a range overnight of 0.5773 - 0.5795, Asia is trading around 0.5780. The NZD stalled again toward the 0.5800 area and for the first time is potentially showing some signs of exhaustion with the USD rebounding as we approach the FOMC meeting. On the day, watch to see if price can get any momentum to break through 0.5800 and regain momentum, this is probably a tough ask with the FOMC ahead. First support is around the 0.5750-0.5760 area if this does not hold it could signal a retracement to the more important 0.5670/0.5700 area. The FOMC tomorrow morning will dictate which side is tested, the market though is clearly a little worried about a hawkish cut.
- (Bloomberg) -- Reserve Bank of New Zealand Governor Anna Breman spoke in Wellington. “Importantly there is no preset course for monetary policy. So we will adjust if we see the outlook for inflation changes”. Says going into the next policy meeting it’s “very important that we look at new data.”
- Options : Closest significant option expiries for NY cut, based on DTCC data: 0.5700(NZD557m), 0.5800(NZD475m). Upcoming Close Strikes : 0.5700(NZD306m Dec 12) - BBG
- The NZD/USD Average True Range for the last 10 Trading days: 35 Points
- Data/Event: Net Migration SA
Fig 1: NZD/USD Spot Daily Chart
Source: MNI - Market News/Bloomberg Finance L.P
USDCAD TECHS: Bull Channel Support Breached
- RES 4: 1.4140 High Nov 5 and a key resistance
- RES 3: 1.4051 High Nov 28
- RES 2: 1.3939/3984 Low Nov 28 / 20-day EMA
- RES 1: 1.3888 Low Oct 29
- PRICE: 1.3833 @ 16:55 GMT Dec 9
- SUP 1: 1.3800 Low Dec 08
- SUP 2: 1.3769 61.8% retracement of the Jun 16 - Nov 6 bull cycle
- SUP 3: 1.3727 Low Sep17
- SUP 4: 1.3682 76.4% retracement of the Jun 16 - Nov 6 bull cycle
A bear theme in USDCAD remains intact and last Friday’s strong sell-off reinforced current conditions. The pair has breached an important support at 1.3950, the base of a bull channel drawn from the Jul 23 low. The break highlights a stronger bear cycle and signals scope for an extension towards 1.3769 next, a Fibonacci retracement point. Initial firm resistance to watch is 1.3984, 20-day EMA.