OIL PRODUCTS: Oil Products Summary at European Close: Diesel Cracks Rise on Week
The US diesel crack has regained earlier intraday losses to reach a new 10-month high. The crack is on track for a weekly gain of 9.5% amid supply concerns following the latest US sanctions on Russia.
- US gasoline crack up 0.8$/bbl at 10.98$/bbl
- US ULSD crack up 0$/bbl at 31.2$/bbl
- The Colonial Pipeline’s Line 1 is due to restart today.
- Editors at oilprice.com note that following two years of bumper profits, US refiners are bracing for a tougher period ahead as gradually weakening fuel demand growth.
- Germany’s Bayernoil has reported a fire in the 86kb/d Neustadt section of the Bayernoil refinery,
- LyondellBasell’s 264kb/d Houston, Texas refinery will begin shutting units from January 20, according to Bloomberg sources.
- Petronor announce that crude unit 2 of its 220k b/d Bilbao refinery will be put into operation Jan. 17, once maintenance work has been carried out.
- Seaborne oil product exports from Russia rose 10.8% m/m in December to 10.37m tons, according to Reuters.
- Germany’s oil product sales fell 3.8% on the year in October, led by an 11% decline in diesel sales, according to Ministry data cited by Bloomberg.
- China's oil refinery throughput fell 1.6% in 2024 to 708.4m tons, NBS showed, amid soft demand and weak margins.
- China’s teapots in Shandong reduced run rates to the lowest since Nov. 8 at 50.68% of capacity in the week to Jan. 17, according to OilChem.
- Up to 10% of China’s oil refining capacity faces closure in the next 10 years, Reuters said.
- Chinese EV brands and fiscal incentives will have a measurable impact on the Se Asia’s gasoline demand growth, Kpler said.
Want to read more?
Find more articles and bullets on these widgets:
Historical bullets
December Dot Plot: Longer-Run Likely To Continue Heading Higher (2/2)
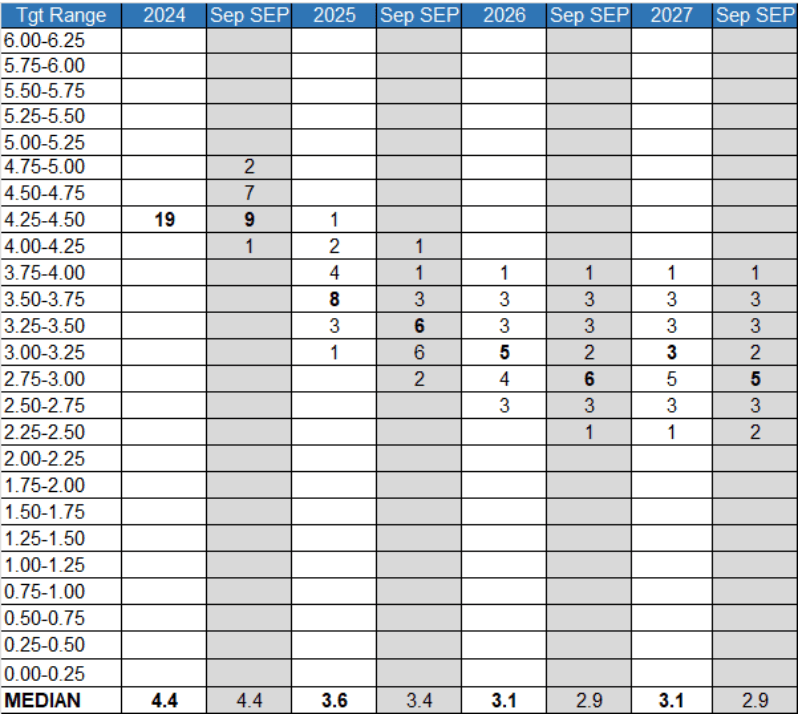
- 2026-27: While the 2025 median will show a rise vs September, we would expect the number of cuts in 2026 to remain roughly the same: 50bp (to 3.1%, up from 2.9% prior). However there may be no further cutting in 2027 (to steady at 3.1%, vs 2.9% in the September projections). That’s largely contingent on an increase in the longer-run dot, however, and we think the 2027 split will be very close between 2.9 and 3.1%.
- Longer-Run: The longer-run dot has shifted up in each quarterly projection so far in 2024, from 2.50% last December, to 2.625% in March, to 2.75% in June, and finally to 2.875% in September.
- There were 9 participants at 3.00% or above (including 7 at 3.25% or above), with 2 on 2.875% and 8 below that (2.375% the lowest dot). This means it would take only one of 10 dots dot to shift above 2.875% to move the median higher to 3.00%, and we would not be surprised to see such a move.
- That would bring it back to a level last seen in September 2018, and up from the trough of 2.40% in 2022.

FED: US TSY 17W BILL AUCTION: HIGH 4.220%(ALLOT 75.52%)
- US TSY 17W BILL AUCTION: HIGH 4.220%(ALLOT 75.52%)
- US TSY 17W BILL AUCTION: DEALERS TAKE 31.85% OF COMPETITIVES
- US TSY 17W BILL AUCTION: DIRECTS TAKE 4.73% OF COMPETITIVES
- US TSY 17W BILL AUCTION: INDIRECTS TAKE 63.41% OF COMPETITIVES
- US TSY 17W BILL AUCTION: BID/CVR 2.97
December Dot Plot: Higher Rates Profile (1/2)
With the 2024 dot unchanged from the last quarterly projections (the Fed will have achieved the median level forecast in September, at 4.4%), most focus will be on the 2025 outlook. With few exceptions, FOMC officials have signalled less enthusiasm for easing policy than was the case at the September meeting, and this will be reflected in higher medians. We also think that the longer-run dot will rise once again, effectively putting a higher floor on the terminal rate. Below is a summary table of our expectations for the Dot Plot distribution in 2024-2027:
- 2025: The end-2025 median is likely to be moved up either 25bp or 50bp. The most recent inflation and unemployment rate data tips the balance toward a 25bp adjustment.
- Virtually every member of the Committee, from Chair Powell on down, has implied or outright said that the pace of easing envisaged in September can be dialled back somewhat in light of an apparent diminishing downside risks to employment and unexpectedly stubborn inflation in Sep-Oct. In the last Dot Plot, the 3.4% median was fairly solid, with 6 participants on that figure, and a further 8 below that.
- As such it would take a lot of movement across the FOMC to move it up 50bp. More likely, we think we’ll see about 6 of the lowest 8 dots moving up to either 3.4% or 3.6%, and a couple of the 6 at 3.4% moving up a notch.
- Our expectation is also anchored by one of the rare explicit Dot Plot forecasts by a current voter: one of the newest FOMC members, Cleveland Fed Pres Hammack, noted on
Dec 6 that "financial markets appear to be pricing in about one reduction in the fed funds target range between now and the end of January and only a few cumulative reductions by the end of 2025. This path is consistent with my current expectation for the funds rate". - Given where market pricing stood at the time, showing a 25bp cut through Jan 2025, and a further 60bp of cuts in 2025 beyond that to 3.75%, we interpret her comments to
mean support for a 2 or 3-cut median for the updated projections for end-2025 (3.6% or 3.9%). Hammack’s economic outlook appears consistent with that of a hawkishleaning member and we’d see her pencilling in 2 or fewer cuts to 3.9%, along with 6 or so of her colleagues, but leaving the median slightly lower at 3.6%.