NZD: NZD/USD - Move Lower Stalls Below 0.5650 As Risk Recovers
The NZD/USD had a range overnight of 0.5639 - 0.5665, Asia is trading around 0.5660. Was that it ? The dip buyers look once again to be in control and what looked like the start of a correction for risk has quickly petered out. The NZD move lower has stalled finding some demand below 0.5650 as risk stabilsed. While price remains below the 0.5800/50 area I suspect rallies will continue to be faded looking for a potential move back towards the 0.5500/0.5600 area. The NZD stands out as a vehicle to short against a resurgent USD but it is worth noting that because of the size of the market it can very quickly become all positioned the same way. I think the USD will need to do the heavy lifting and break above its pivotal resistance for the NZD to test the 0.5500 lows. The first sell zone on the day would be back toward the 0.5700-0.5725 area.
- Bloomberg reported on Hawkesby's speech at parliament, “RBNZ’s Hawkesby Says Labor Market Has Deteriorated as Expected. “As a central case we think things are going to get better”, says monetary policy is working, citing evidence in the commercial property market that lower rates are coming through.”
- Options : Closest significant option expiries for NY cut, based on DTCC data: 0.5730(NZD496m), 0.5780(NZD305m). Upcoming Close Strikes : none - BBG
- Data/Event: Today, the local calendar will see the RBNZ at the Select Committee to discuss the FinStab Report, and the Government will release its 3-Month Financial Statements.
Fig 1: NZD/USD Spot Daily Chart
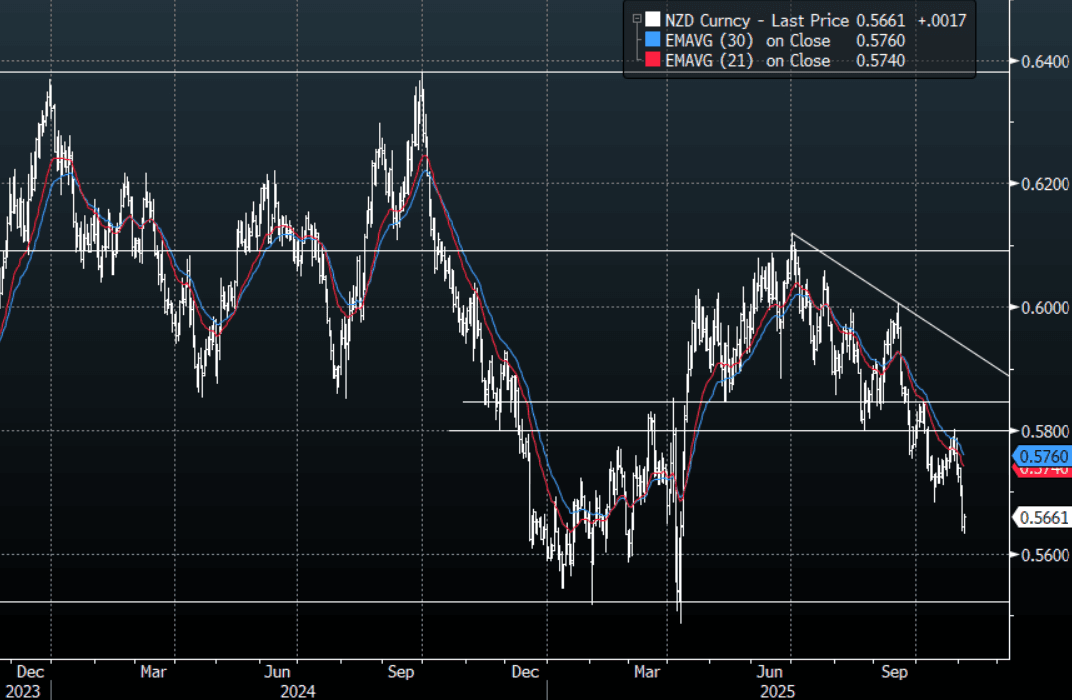
Source: MNI - Market News/Bloomberg Finance L.P
Want to read more?
Find more articles and bullets on these widgets:
Historical bullets
ASIA: Coming Up In Asia Pac Markets On Tuesday
| 0030BST | 0730HKT | 1030AEDT | Australia Oct Westpac Consumer Sentiment |
| 0030BST | 0730HKT | 1030AEDT | Japan Aug Household Spending |
| 0130BST | 0830HKT | 1130AEDT | Australia Sep ANZ Job Ads |
| 0435BST | 1135HKT | 1435AEDT | Japan 30yr Bond Sale |
| 0600BST | 1300HKT | 1600AEDT | Japan Aug P Leading & Coincident Indices |
Source: Bloomberg Finance L.P./MNI
STIR: Fed Rate Path Steadies With Heavy Fed Comms, Thin Data Slate This Week
Fed funds futures-implied pricing for the end-October FOMC meeting was steady Monday, with no change to the 22bp cut expectation (near 90% prob of a 25bp cut) that had been implied at Friday's close.
- There was some movement further down the rate strip, with about 2bp of cumulative cuts removed from the path through June 2026 (6 meetings away), in sympathy with a broader bear-steepening move on the broader Treasury curve. There's a total 44bp of cuts priced through the last two meetings of the year, with 84bp priced through next June.
- With no sign of an end to the federal government shutdown impasse, an already-thin data slate this week is even thinner: Tuesday's trade balance and Thursday's jobless claims/inventories data are almost certain to be postponed. Tuesday's Redbook retail sales, NY Fed consumer expectations survey (with inflation expectations readings) and consumer credit data have rarely moved markets, while the only items due for the rest of the week are MBA Mortgage applications, Federal Budget Balance figures, and UMichigan (prelim October) Friday.
- That leaves the focus on Fed communications, to the degree that we can glean any more from Fed speakers than they have already revealed about their preferences. - all have already spoken since the September FOMC meeting. Shortly (1700ET) we get KC Fed's Schmid speaking about the monetary policy outlook; as a hawk and 2025 FOMC voter we see him as not envisaging any further cuts this year as of the most recent Dot Plot.
- Tuesday brings mostly doves: Bowman, Miran, and Kashkari each support at least 2 more cuts by end-2025, while Bostic has said he only penciled in one (total) rate cut this year in his Dot Plot. If anything most interesting would be how each sees the ongoing government shutdown affecting their perception of the risks to the outlook and their navigation of the data.
- Wednesday sees the publication of the minutes to the September FOMC. As noted, almost all members of the Committee have already spoken since then, so the Minutes should bring limited surprises on the rate outlook, but we'll be looking for any discussion about balance sheet policy (and will be intrigued by how Miran's introduction to the Committee translates into the description of the proceedings).. We'll publish our usual Minutes preview on Tuesday.
| Meeting | Current FF Implieds (%), LH | Cumulative Change From Current Rate (bp) | Incremental Chg (bp) | Prior Session (Oct 03) | Chg Since Then (bp) |
| Oct 29 2025 | 3.86 | -22.2 | -22.2 | 3.86 | 0.0 |
| Dec 10 2025 | 3.64 | -44.0 | -21.8 | 3.64 | 0.4 |
| Jan 28 2026 | 3.54 | -54.3 | -10.3 | 3.53 | 0.9 |
| Mar 18 2026 | 3.44 | -64.4 | -10.1 | 3.41 | 2.2 |
| Apr 29 2026 | 3.37 | -70.8 | -6.4 | 3.35 | 1.9 |
| Jun 17 2026 | 3.24 | -83.9 | -13.1 | 3.22 | 2.0 |
USDCAD TECHS: Trend Needle Points North
- RES 4: 1.4111 High Apr 10
- RES 3: 1.4061 3.0% Upper Bollinger Band
- RES 2: 1.4019 38.2% retracement of the Feb 3 - Jun 16 bear leg
- RES 1: 1.3987 200-dma
- PRICE: 1.3947 @ 16:32 BST Oct 6
- SUP 1: 1.3897/3830 Low Sep 30 / 50-day EMA
- SUP 2: 1.3727 Low Aug 29 and a bear trigger
- SUP 3: 1.3689 Low Jul 28
- SUP 4: 1.3637 Low Jul 25
A bull cycle in USDCAD remains intact and last week’s break above the late September’s high, firms the bullish theme. This move higher also maintains the bullish price sequence of higher highs and higher lows. Note too that moving average studies are in a bull-mode position, highlighting a dominant uptrend. Sights are on 1.4019, a Fibonacci retracement point. On the downside, first key support lies at 1.3830, the 50-day EMA.