EURUSD TECHS: Monitoring Support
- RES 4: 1.1919 High Sep 17 and a bull trigger
- RES 3: 1.1820 High Sep 23
- RES 2: 1.1775 61.8% retracement of the Sep 17 - Oct 9 bear leg
- RES 1: 1.1669/1728 High Oct 28 / 17 and key resistance
- PRICE: 1.1568 @ 06:10 GMT Oct 31
- SUP 1: 1.1542 Low Oct 9 and the bear trigger
- SUP 2: 1.1516 76.4% retracement of the Aug 1 - Sep 17 bull leg
- SUP 3: 1.1392 Low Aug 1 and bear trigger
- SUP 4: 1.1313 Low May 30
EURUSD traded lower Thursday and support remains exposed. The level to watch lies at 1.1542, the Oct 9 low. Clearance of this support would confirm a resumption of the bear cycle that started Sep 17. A break would open 1.1516, a Fibonacci retracement. Clearance of 1.1516 would expose key support at 1.1392, the Aug 1 low. Price needs to trade above 1.1728, the Oct 17 high, to reinstate a bull theme.
Want to read more?
Find more articles and bullets on these widgets:
Historical bullets
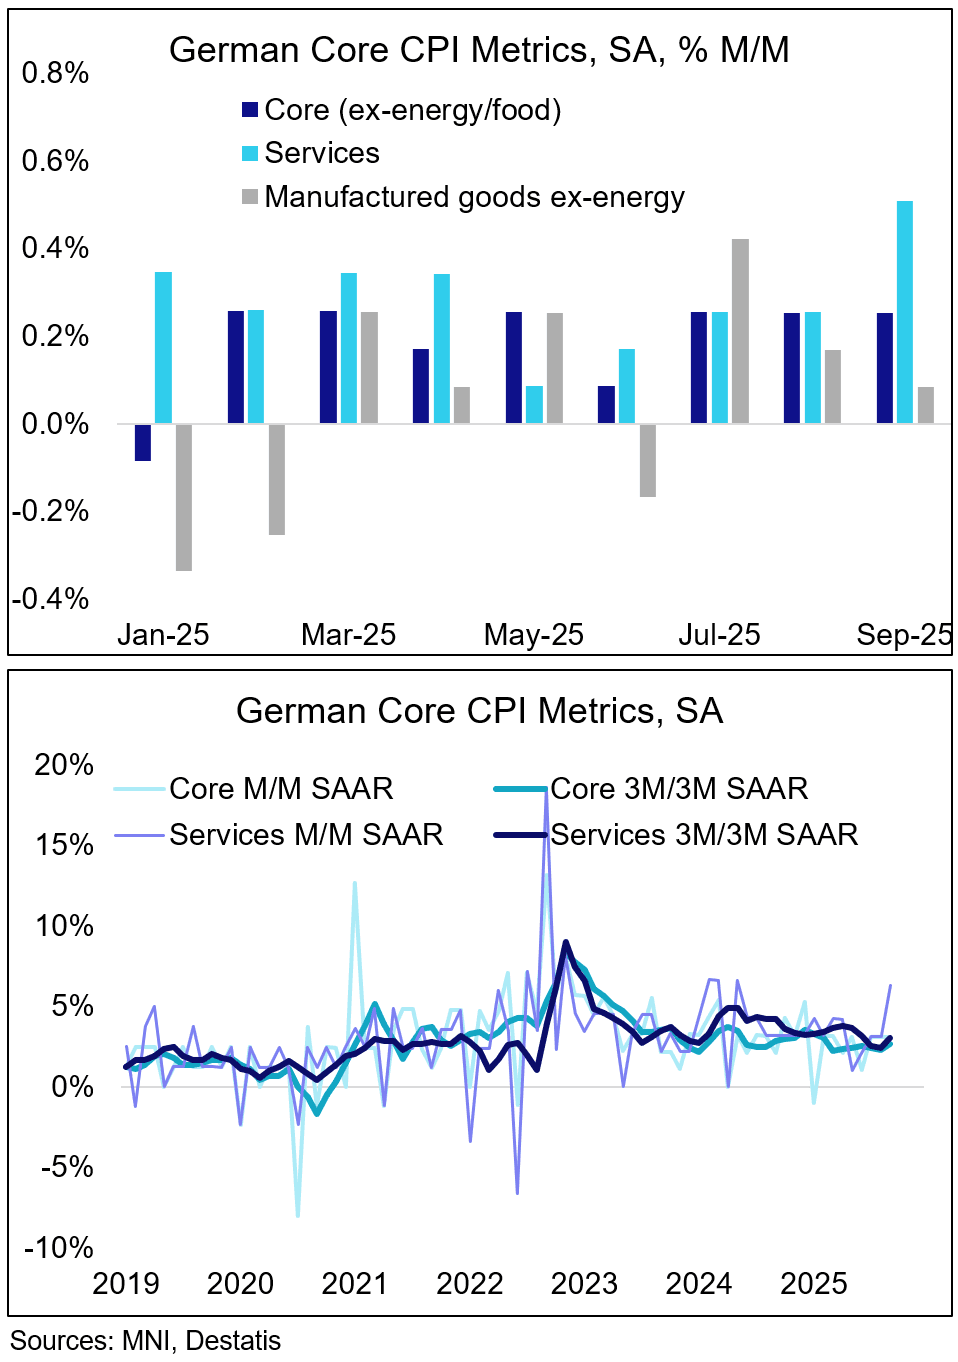
EUROPEAN INFLATION: Sequential Services Spike In Germany In SA Buba Data
German sequential services inflation (as per seasonally adjusted Bundesbank data released yesterday) spiked in September, to 0.51% M/M, its highest rate since May 2024 (vs 0.25% prior, 6.3% annualized).
- This looks to be an upward surprise, as ahead of the non-SA Destatis release, analysts saw the services Y/Y rate lower in Germany this time - that has not happened as per an acceleration to 3.4% (from 3.1% prior). Services-heavy subcategories that seem likely to print higher in September (judging from state-level data) are recreation and culture as well as restaurants and hotels. It is not quite clear yet what impact airfares had this time.
- The services spike was countered by a deceleration in manufactured goods ex-energy, which came in at 0.08% M/M (0.17% prior, 1.0% annualized).
- On balance, this left German sequential core CPI unchanged vs August on a sequential comparison, at 0.25% M/M (3.1% annualized).
- On a 3m/3m SAAR basis, core CPI was 2.6% in September (vs 2.3% prior, highest rate since February). On this less volatile measure, both subcategories came in higher than previously: services accelerated to 3.0% (2.4% prior), while manufactured goods ex-energy was 2.2% (1.5% prior).
INDONESIA: Inflation Remains Contained, IDR Weaker Than Sept BI Decision
September core inflation held at 2.2%, 0.3pp below April’s peak, while headline was higher than expected at 2.65% up from August’s 2.3% due to higher volatile food prices and gold jewellery. Both measures remain well within Bank Indonesia’s 1.5-3.5% target band but with USDIDR at 16685 up 1.5% since the 17 September decision to cut rates, FX stability may become more important in October. Recent decisions have surprised with the focus on supporting efforts to boost growth rather than on the rupiah.
- The 6.4% y/y increase in food prices was driven by rice, chili and shallots.
- Global gold was up almost 12% over September and 47% higher than end-2024, therefore it is unsurprising that this has fed through to jewellery prices.
- State-administered prices remained subdued at 1.1% y/y.
- Clothing, utilities, dining out, IT & financial services and recreation saw stable inflation rates, while personal care, healthcare, transportation were higher and education and household equipment lower.
Indonesia CPI y/y%
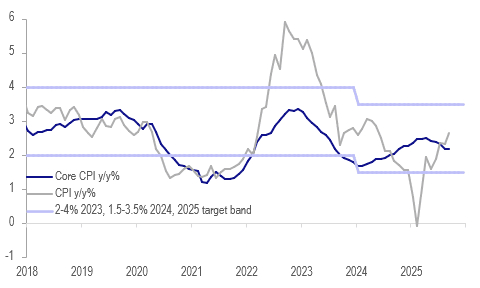
Source: MNI - Market News/LSEG
US DATA: Federal Gov't Shutdown: Unemployment, GDP Impacts (2/2)
How would data collection be affected? As the Department of Labor warns, "All active data collection activities for BLS surveys will cease....A reduction in quality of data collected might impact the quality of future estimates produced." Using 2013's October employment report as an example of how this might play out:
- The report was scheduled for release on Friday Nov 1 but was pushed back a week to Nov 8 as the BLS needed more time to get the report together.
- For that report the household survey week was Oct 6-12, and the survey scheduled to start Oct 13 was postponed by a week because of the shutdown. The survey reference week was unchanged and the response rate was "within its normal range". For the establishment survey, the reference week is the pay period that includes the 12th of the month. As such this survey was similarly impacted as the household one was, but there's also the revisions to consider, per the BLS post-mortem of that episode: "Collection continues for about 2 months, and the estimates are revised twice after their initial release to reflect the additional data collected. From October 1 through October 16, 2013, BLS normally would have collected data to be used for the August final, September second preliminary, and October preliminary establishment survey estimates. October data collection began shortly after BLS reopened." That having been said, "The response rate for the establishment survey was above average."
How would the data itself be impacted? Again using the October 2013 payrolls report as an example: for the establishment report, the BLS notes there were "no discernible impacts of the partial federal government shutdown on the estimates of employment, hours, and earnings. Federal employees on furlough during the partial government shutdown were still considered employed in the payroll survey because they worked or received pay for the pay period that included the 12th of the month" - this is because workers who are paid for any part of a pay period are defined as employed.
- However, "some of the estimates from the household survey clearly reflect an impact of the partial government shutdown. This is due to differences in the concepts and definitions used in the two surveys. In the household survey, workers who indicate that they were not working during the entire reference week due to a shutdown-related furlough and expect to be recalled to their jobs should be classified as unemployed on temporary layoff, whether or not they are paid for the time they were off work. In October, many furloughed federal employees were so classified, contributing to a rise in the overall number of persons unemployed on temporary layoff."
- This meant 223k federal workers were on temporary layoff in the month on a non-seasonally-adjusted basis (around 200k larger than normal), with 307k classified as employed with a job but not at work (again, around 200k larger than usual). The BLS doesn't adjust the household survey findings, but estimated that "If the federal workers who were recorded as employed but absent from work had been classified as unemployed on temporary layoff, the overall unemployment rate would have been slightly, but not substantively, higher than reported" - an estimated 0.1pp higher.
- We'll look more closely at impacts on CPI if the shutdown persists into next week, but here is what the BLS said in the October CPI report (which was pushed back a week): "Data collection, data review and index computation commenced shortly after the end of the shutdown. In order to minimize the impact of the shutdown on the quality and timeliness of the index, resources normally devoted to maintenance and improvement work were redirected into data collection and index production. The sample of prices used to calculate the October index was about 75 percent of the amount usually used in the CPI." Given methodological issues in the current year with data collection, with impacts from funding cutbacks already pinching, this could make for a very idiosyncratic October report if it comes to that.
- In terms of GDP, there could be a hit based on the BEA's methodology of reducing its growth estimate based on the number of federal government worker hours lost (feeding through to the real government consumption expenditure category). We've seen estimates of an impact around 0.1 (Morgan Stanley)-0.2pp (Deutsche ) subtracted from quarterly annualized GDP for each week that the shutdown goes on, assuming 800k employees are furloughed. Coming into this week, the Atlanta Fed GDPNow estimate for the quarter is for close to 4%, so this wouldn't be a major drag on activity. However the longer it goes on for, the more impact it will have, especially to the degree that it spills into private sector activity.