SCANDIS: Modest NOKSEK Downside Following Early Data
NOKSEK moves 0.1% lower following this morning’s Norwegian inflation and Swedish activity data, now at 0.9462. The cross remains in a sideways trend, with key resistance seen around 0.9500.
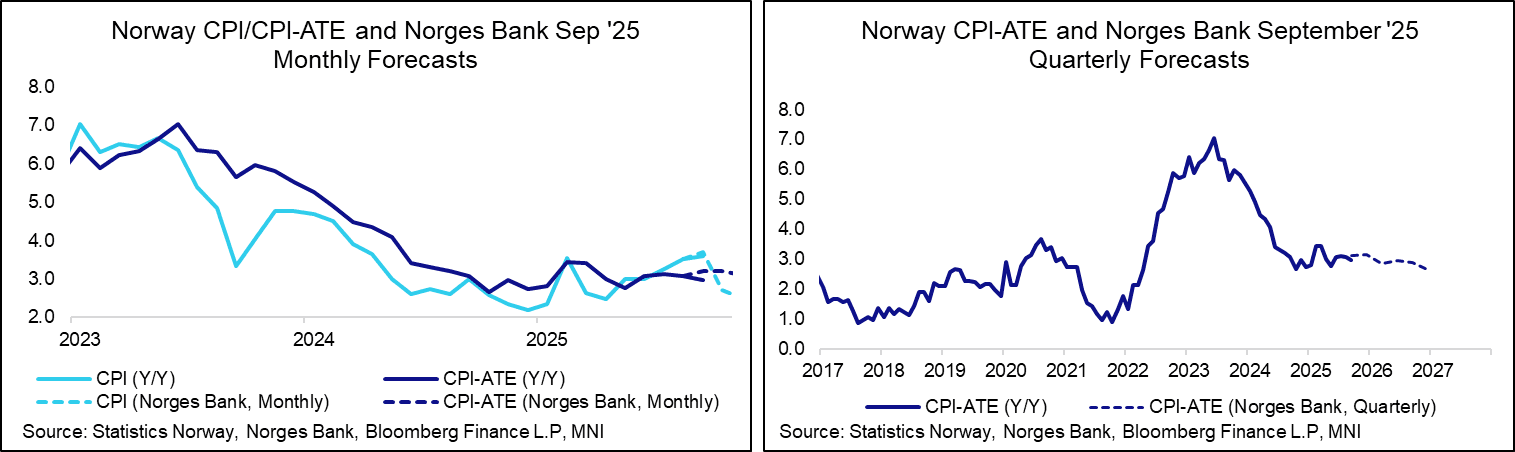
- Norway September CPI-ATE inflation was 2.98% Y/Y (vs 3.07% prior), below the 3.1% consensus and 3.2% Norges Bank projections. While dovish on net, we still think Norges Bank will need to see much more evidence of declining underlying price pressures before deviating from its cautious stance, particularly with mainland demand still relatively resilient.
- Swedish August GDP rose 1.1% M/M, with July’s reading revised down a tenth to -0.3%. The three analyst estimates submitted to Bloomberg ranged from -0.2% to 0.3% M/M, so it’s a solid beat. Private sector production rose 0.9% M/M (vs -1.6% prior) while household consumption rose 0.4% M/M (vs 0.2% prior). As always, we caution reading too much into the monthly activity data, which can be volatile and revision prone.
- Still, it supports analyst, Riksbank and Government expectations for a cyclical recovery in activity going forward. The Riksbank is likely to remain at 1.75% for the foreseeable future, with the risk of a hike back to 2.00% outweighing the risk of another cut.
Want to read more?
Find more articles and bullets on these widgets:
Historical bullets
BTP TECHS: (Z5) Bullish Trend Condition
- RES 4: 121.00 Round number resistance
- RES 3: 120.74 High Aug 5 and the bull trigger
- RES 2: 120.61 High Aug 14
- RES 1: 120.42 High Sep 5
- PRICE: 120.21 @ Close Sep 9
- SUP 1: 119.06/118.36 Low Sep 4 / 3
- SUP 2: 118.00 Round number support
- SUP 3: 117.70 2.236 proj of the Aug 5 - 12 - 14 price swing
- SUP 4: 117.36 2.500 proj of the Aug 5 - 12 - 14 price swing
The primary trend condition in BTP futures is unchanged, it remains bullish. The strong rally from last week’s low highlights a bullish development and signals the end of the recent corrective pullback between Aug 5 - Sep 3. Key resistance and the bull trigger is 120.74, the Aug 5 high. A break of this hurdle would confirm a resumption of the uptrend. Key support has been defined at 118.36, the Sep 3 low.
GILT TECHS: (Z5) Corrective Cycle Still In Play
- RES 4: 92.30 High Aug 7
- RES 3: 92.06 High Aug 14
- RES 2: 92.00 Round number resistance
- RES 1: 91.66 High Sep 9
- PRICE: 91.36 @ Close Sep 9
- SUP 1: 90.65 Low Sep 2
- SUP 2: 90.31/89.36 Low Sep 4 / 3
- SUP 3: 89.22 1.618 proj of the Aug 21 - 27 - 28 price swing
- SUP 4: 89.00 Round number support
A rally in Gilt futures last week and bullish start to this week’s session, highlights a stronger corrective cycle. The move higher is allowing an oversold trend condition to unwind. The contract has breached initial firm resistance at 90.84, the Aug 28 and 29 high. A continuation higher would open 92.06, the Aug 14 high. On the downside, initial support lies at 90.65, the Sep 5 low.
USDJPY TECHS: Monitoring Support
- RES 4: 151.62 61.8% retracement of the Jan 10 - Apr 22 bear leg
- RES 3: 150.92 High Aug 1 and a key resistance
- RES 2: 149.81 76.4% retracement of the Aug 1 - 14 bear leg
- RES 1: 147.61/149.14 20-day EMA / High Sep 3
- PRICE: 147.43 @ 06:59 BST Sep 10
- SUP 1: 146.21 Low Aug 14
- SUP 2: 145.86 Low Jul 24
- SUP 3: 145.53 Trendline drawn from the Apr 22 low
- SUP 4: 145.40 50% retracement of the Apr - Aug upleg
USDJPY continues to trade inside a range. Attention is on key short-term support at 146.21, the Aug 14 low and a bear trigger. A break of this level would highlight a stronger bearish threat and highlight a range breakout. This would expose 145.40, a Fibonacci retracement. On the upside, clearance of 149.14, the Sep 3 high is required to reinstate a bullish theme. Moving average studies are in a bull-mode position, highlighting a dominant uptrend.