MNI US MARKETS ANALYSIS - DXY Looks to Break Major Trendline
Highlights:
- Mixed messages from break of major downtrend in USD Index
- Powell watched carefully for any retort to Trump's criticism of the Fed chair
- Gold returns higher as soft real yields buoy demand for precious metals
US TSYS: Underperforming EGBs Ahead Of Powell, ISM Mfg, JOLTS and OBBB 2nd Day
- Treasuries have extended Monday’s gains as part of broader FI rallies, underperforming EGBs.
- OBBB voting has extended into today as Senate Republican leaders are struggling to secure enough votes for it, with Bloomberg reporting 8 holdouts versus only 3 to spare.
- Today’s economic calendar is kickstarted by Fed Chair Powell in a panel at the ECB’s Sintra conference before being closely followed by the final manufacturing PMI, ISM manufacturing (preview part 1 and part 2) and JOLTS reports in a busy mid-morning.
- Cash yields are 1-3.5bp lower on the day, led by 7s.
- 5s30s at 98bps holds yesterday’s flattening away from last week’s ytd highs of 103.3bps.
- TYU5 trades at 112-11 (+ 07) on slightly above average cumulative volumes of 325k.
- It earlier touched a high of 112-12 as it approaches an important resistance at 112-15 (61.8% retrace of Apr 7-11 sell-off), after which lies 112-23 (May 1 high). The bull cycle remains intact but the uptrend is overbought.
- Data: S&P Global US mfg PMI Jun final (0945ET), ISM mfg Jun (1000ET), JOLTS May (1000ET), Construction spending May (1000ET), Dallas Fed services Jun (1030ET)
- Fedspeak: Powell in Sintra panel (0930ET) – see STIR bullet
- Bill issuance: US Tsy $50B 6W bill auction (1130ET)
STIR: US Terminal Rate Seen Close To Post-Election Lows, Powell Panel Ahead
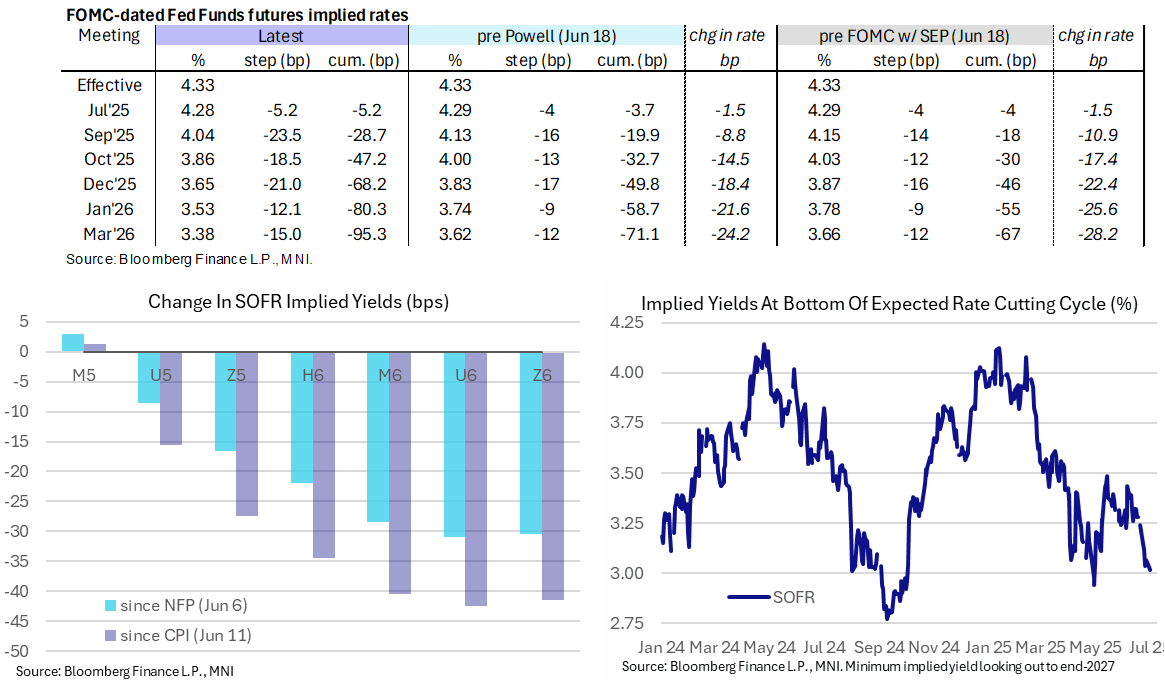
- Fed Funds implied rates are 0-1.5bp lower on the day for 2025 meetings, marginally shoring up a next cut in September whilst year-end expectations widen the gap with the median dot (68bp vs 50bp cuts pencilled in two weeks ago).
- Cumulative cuts from 4.33% effective: 5bp Jul, 28.5bp Sep, 47bp Oct, 68bp Dec, 80bp Jan and 95bp Mar.
- The SOFR implied terminal yield of 3.015% (SFRZ6, -1.5bp) last closed lower on Apr 29 and 30 (and before that pre-US election on Oct 2024) as it increasingly firmly prices five cuts for what’s left of the easing cycle.
- Today’s sole scheduled Fedspeak comes from Chair Powell speaking at the ECB’s Sintra conference. He’s on a panel with ECB’s Lagarde, BOE’s Bailey, BOJ’s Ueda and BOK’s Rhee at 0930ET.
- We have had limited major data releases since his congressional appearances last week, which in turn followed soon after the Jun 18 FOMC press conference, although Thursday did see surprisingly weak domestic demand revisions for Q1 before soft consumer spending in May on Friday.
- His House appearance saw treasuries rise and the USD pull back on headlines that appeared to suggest earlier rate cuts are possible "*POWELL: LOWER INFLATION, WEAKER LABOR COULD MEAN EARLIER CUT" (Bloomberg). However, the full context of this was that he was asked whether he concurs with Gov Waller about a potential path for "good news" to lead to rate cuts, Powell keeps the option conditionally open but not an unsolicited comment or an endorsement - and indeed he also notes potential for later cuts too.
- More broadly, Powell again implied that the September FOMC is the next live meeting.
SOFR: Mix Of Positioning Swings Seen In Futures On Monday
OI data points to a mix of positioning swings in SOFR futures as the strip twist flattened on Monday:
- The whites saw a mix of net short setting (SFRM5), long setting (SFRU5) and short cover (SFRZ5 & H6).
- Meanwhile, net long setting was more prominent in the red & blue packs
- Net short cover dominated in the greens.
| 30-Jun-25 | 27-Jun-25 | Daily OI Change |
| Daily OI Change In Packs |
SFRM5 | 1,301,324 | 1,278,882 | +22,442 | Whites | +13,534 |
SFRU5 | 1,123,944 | 1,122,985 | +959 | Reds | +11,895 |
SFRZ5 | 1,272,422 | 1,275,014 | -2,592 | Greens | -11,613 |
SFRH6 | 962,844 | 970,119 | -7,275 | Blues | +3,211 |
SFRM6 | 862,102 | 855,942 | +6,160 |
|
|
SFRU6 | 833,068 | 826,668 | +6,400 |
|
|
SFRZ6 | 956,058 | 949,964 | +6,094 |
|
|
SFRH7 | 706,582 | 713,341 | -6,759 |
|
|
SFRM7 | 647,589 | 652,023 | -4,434 |
|
|
SFRU7 | 454,869 | 456,988 | -2,119 |
|
|
SFRZ7 | 410,377 | 412,370 | -1,993 |
|
|
SFRH8 | 305,708 | 308,775 | -3,067 |
|
|
SFRM8 | 233,201 | 232,190 | +1,011 |
|
|
SFRU8 | 205,032 | 208,073 | -3,041 |
|
|
SFRZ8 | 189,490 | 181,392 | +8,098 |
|
|
SFRH9 | 138,146 | 141,003 | -2,857 |
|
|
US TSY FUTURES: Meaningful Long Setting Seen Monday
OI data points to meaningful net long setting during Monday's rally, with the most prominent positioning swings coming in the long end as UXY, US & WN futures accounted for a cumulative ~$12.6mn of the ~$14.9mn net exposure added on the day.
| 30-Jun-25 | 27-Jun-25 | Daily OI Change | OI DV01 Equivalent Change ($) |
TU | 4,312,093 | 4,270,851 | +41,242 | +1,594,019 |
FV | 7,126,831 | 7,113,782 | +13,049 | +570,368 |
TY | 5,043,884 | 5,041,941 | +1,943 | +130,272 |
UXY | 2,430,287 | 2,411,405 | +18,882 | +1,675,923 |
US | 1,796,080 | 1,757,395 | +38,685 | +4,950,422 |
WN | 1,936,181 | 1,904,180 | +32,001 | +5,950,804 |
|
| Total | +145,802 | +14,871,807 |
UK FISCAL: OBR Forecast Evaluation Report Highlights
The OBR forecast evaluation report is out, some highlights below. Note that this is an annual report, so is not hugely different to what we have seen in recent years. Highlights below:
- "The updated assessment of our forecasting record since 2010... shows that the OBR’s economic and fiscal forecasts have tended to be somewhat pessimistic in the near-term and optimistic in the medium term."
- "The OBR’s forecast performance over the past twelve years has been similar to that of other UK external forecasters, which exhibit a common pattern of near-term pessimism and medium-term optimism."
- "On average, OBR central (point) forecasts have underestimated annual real GDP growth at the one-year horizon (by 0.4 percentage points) and overestimated it at longer horizons, by an average of 0.3 and 0.7 percentage points at the two- and five-year horizons, respectively (top row in Table 2.1). External forecasters, on average, have also underestimated GDP growth at the one-year horizon (by 0.5 percentage points) and also overestimated it at the five-year horizon, albeit by a slightly smaller margin of 0.6 percentage points."
- "OBR forecasts for CPI inflation have, on average, been in-line with outturn, while two- and five-year ahead forecasts have, underestimated inflation by 0.3 and 0.5 percentage points, respectively. External forecasters have, on average, tended to overestimate inflation at the one- and two-year horizon and to underestimate it at the five-year horizon to a similar extent as the OBR forecasts. "
UK FISCAL: Welfare vote this evening and wider implications for markets (1/2)
- Later today, the Commons will hold a debate the on the second reading of the welfare reform bill. The debate is scheduled to finish by 19:00BST with a vote to be held thereafter (so expect results 19:10-19:20BST unless the vote starts earlier than expected).
- This bill is formally known as the “Universal Credit and Personal Independence Payment Bill”. While the government, in one of an increasing series of U-turns to appease the left of the party, has offered major concessions to Labour rebels, it remains to be seen whether this will prove enough to avoid MPs approving an amendment that would scupper the legislation for this parliamentary session.
- To put some context around this, the welfare reforms as originally set out were expected to save GBP5bln per year. The concessions (the main of which is that the changes only apply to future claimants) are expected to cost GBP3bln per year (according to the Resolution Foundation). So only GBP2bln out of the intended GBP5bln would be saved. And the winter fuel payments are expected to cost GBP1.25bln per year (based on Treasury figures). And another concession announced today is that some of the spending in the “Pathways to Work” programme will be brought forward with an extra GBP100mln in FY27/28 and GBP200mlin in FY28/29 before revering back to the previously announced cost in FY29/30. All of this together means that of the GBP9.9bln headroom under the government’s day-to-day spending rules, almost half has already been used.
UK FISCAL: Welfare vote this evening and wider implications for markets (2/2)
- But perhaps even more significantly, the precedent this sets is that it is going to be very difficult for the government to cut spending. Which was always the case to some extent but almost a year ago when the government entered office (4 July 2024) it was thought that the large majority of the Labour party would make reform easier. If it is this hard for the government to control spending so soon after such a large majority, it makes it even harder as the parliament progresses and the next election starts to approach.
- Of course, on top of using up half of the headroom with these U-turns on spending cuts, yields are higher than at the time of the last Budget, inflation is still relatively sticky while the growth and labour market appear to be deteriorating. With more spending cuts looking increasingly difficult, this sets up the potential for more tax rises in the Autumn Budget (with the fiscal rules unlikely to be modified while Reeves is Chancellor. The market (and consumers) are likely to continue to worry where these tax rises will come, which isn’t going to be great for confidence over the next few months.
USD: TECHS: USD Index (DXY) Pierces Key Trendline Support
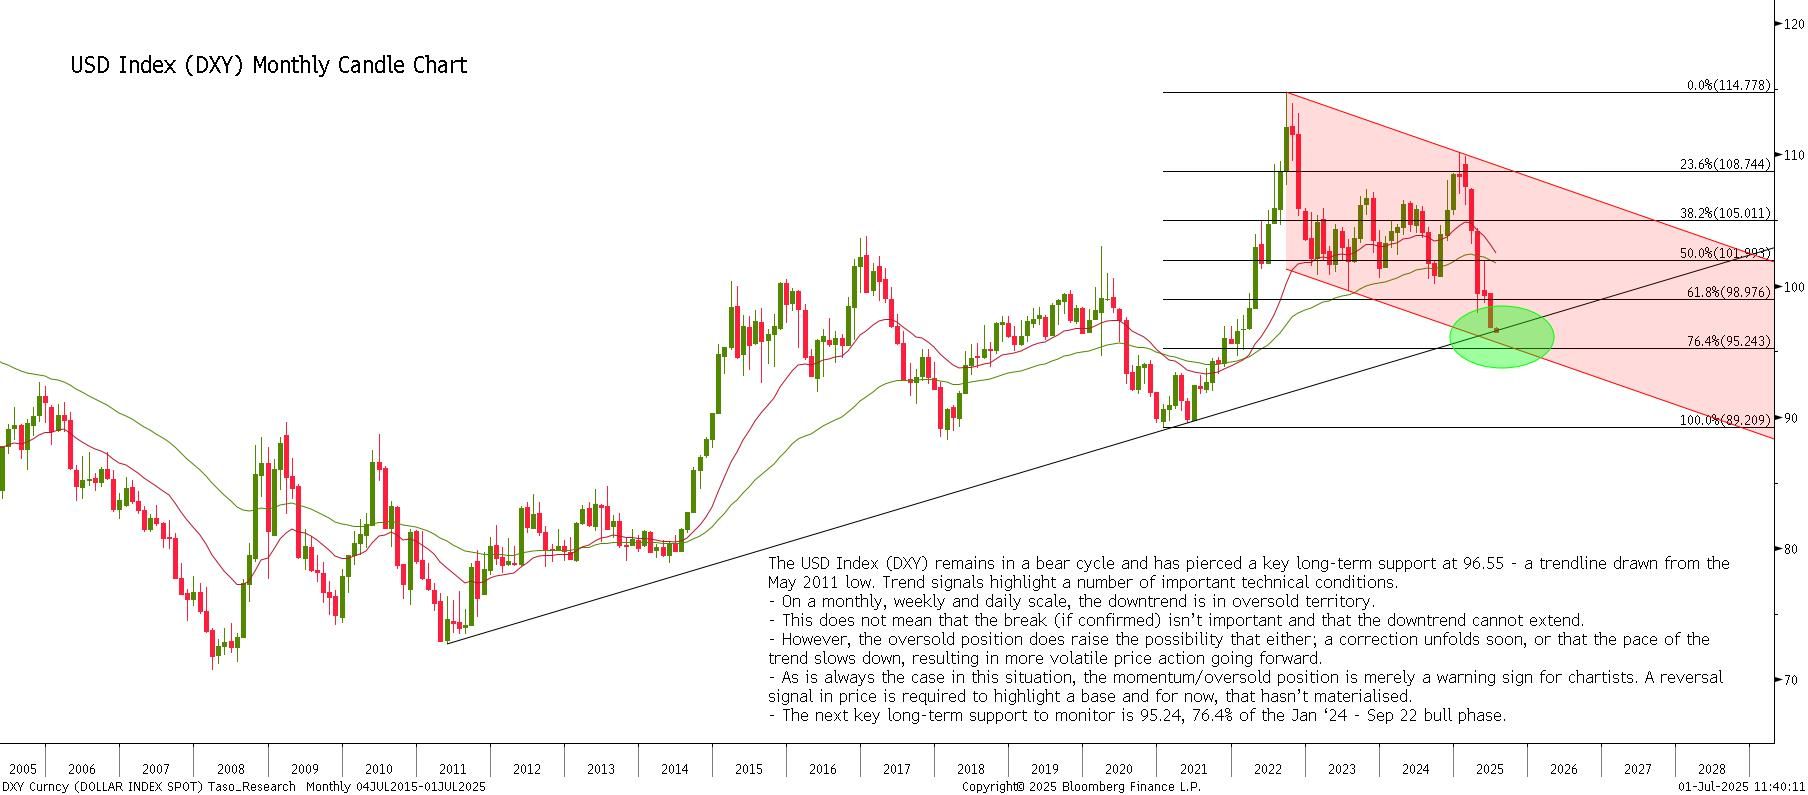
The USD Index (DXY) remains in a bear cycle and has pierced a key long-term support at 96.55 - a trendline drawn from the May 2011 low. Trend signals highlight a number of important technical conditions.
- On a monthly, weekly and daily scale, the downtrend is in oversold territory.
- This does not mean that a trendline break (if confirmed) isn’t important and that the downtrend cannot extend.
- However, the oversold position does raise the possibility that either; a correction unfolds soon, or that the pace of the trend slows down, resulting in more volatile price action going forward.
- As is always the case in this situation, the momentum/oversold position is merely a warning sign for chartists. A reversal signal in price is required to highlight a base and for now, that hasn’t materialised.
- The next key long-term support to monitor is 95.24, 76.4% of the Jan ‘24 - Sep 22 bull phase.
FOREX: USD Index Plumbs a New Low as Curve Conspires Against Dollars
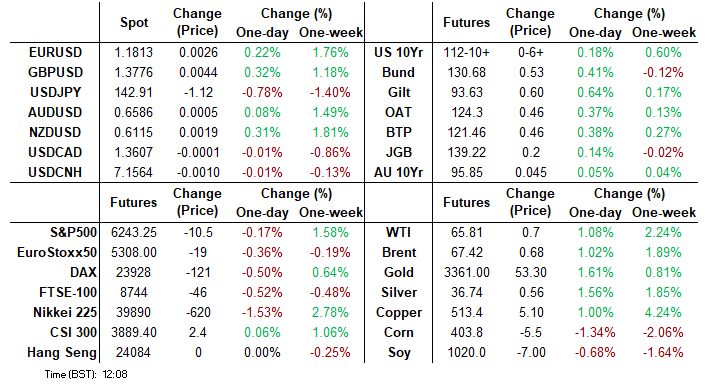
- JPY is comfortably the strongest performer in G10 early Tuesday, with the USD Index extending recent losses to move to new cycle lows. The latest phase of USD sales coincides with an adjustment lower for the US curve, as US 10yr yields slipp to a 2-month low below 4.2% this morning.
- This leaves USD/JPY almost 3.5% off last week's highs, aided by a cleaner positioning profile following last Monday's spike to 148.03. The shooting star candle formation highlights a reversal of the recent recovery and today's weakness in particular has been exacerbated on a break of short-term trendline support, drawn from the May lows.
- For GBP, the latest press lower for the USD has prompted GBP/USD to show to a new cycle high at 1.37893 - this is now the best marked levels since October 2021 and extends the bull cycle in the pair. An uptick in futures volumes on the break to new highs clearly helping here, and shifts focus to 1.38 round number resistance and then the October 20th 2021 high beyond at 1.3835
- The difficulty of passage of today's welfare bill in the House of Commons may not be directly market relevant, but the scale of opposition will serve as a further reminder of the hurdles facing the PM's pro-growth agenda.
- Eurozone CPI estimate came in alongside expectations at 2.0% for June - confirming the ECB's views that inflation should continue to converge with target. ISM Manufacturing data is the scheduled data highlight Tuesday, with markets expecting only a modest improvement in activity for June. Central bank speak is headlined by the ongoing Sintra ECB policy forum, at which central bank heads Lagarde, Powell, Ueda, Bailey and Rhee are all set to make appearances.
OPTIONS: Expiries for Jul01 NY cut 1000ET (Source DTCC)
- EUR/USD: $1.1700(E3.5bln), $1.1750(E891mln), $1.1800(E1.8bln), $1.1820-30(E1.2bln)
- USD/JPY: Y143.40-50($990mln), Y143.60-65($503mln), Y144.50-55($692mln), Y145.00($1.0bln)
- AUD/USD: $0.6235-50(A$1.1bln), $0.6560(A$824mln)
EQUITIES: E-Mini S&P Trend Condition Remains Unchanged and Bullish
- Trend signals in Eurostoxx 50 futures remain bearish, however, the recovery from the Jun 23 low appears to be a reversal and the contract is holding on to its most recent gains. Price has traded through the 20- and 50-day EMAs. A clear break of both averages would strengthen a reversal theme. This would open 5486.00, the May 20 high and bull trigger. On the downside, a breach of 5194.00, the Jun 23 low, would reinstate a bearish theme.
- The trend condition in S&P E-Minis is unchanged, it remains bullish and the contract has started this week on a firm note. Short-term resistance and a bull trigger at 6128.75, the Jun 11 high, has recently been breached. The clear break confirms a resumption of the uptrend that started Apr 7. The 6200.00 handle has been cleared too, this opens 6277.50, the Feb 21 high and bull trigger. Key support is at the 50-day EMA - at 5964.66.
GOLD: Supported By Lower US Real Yields; Possible False Trendline Break
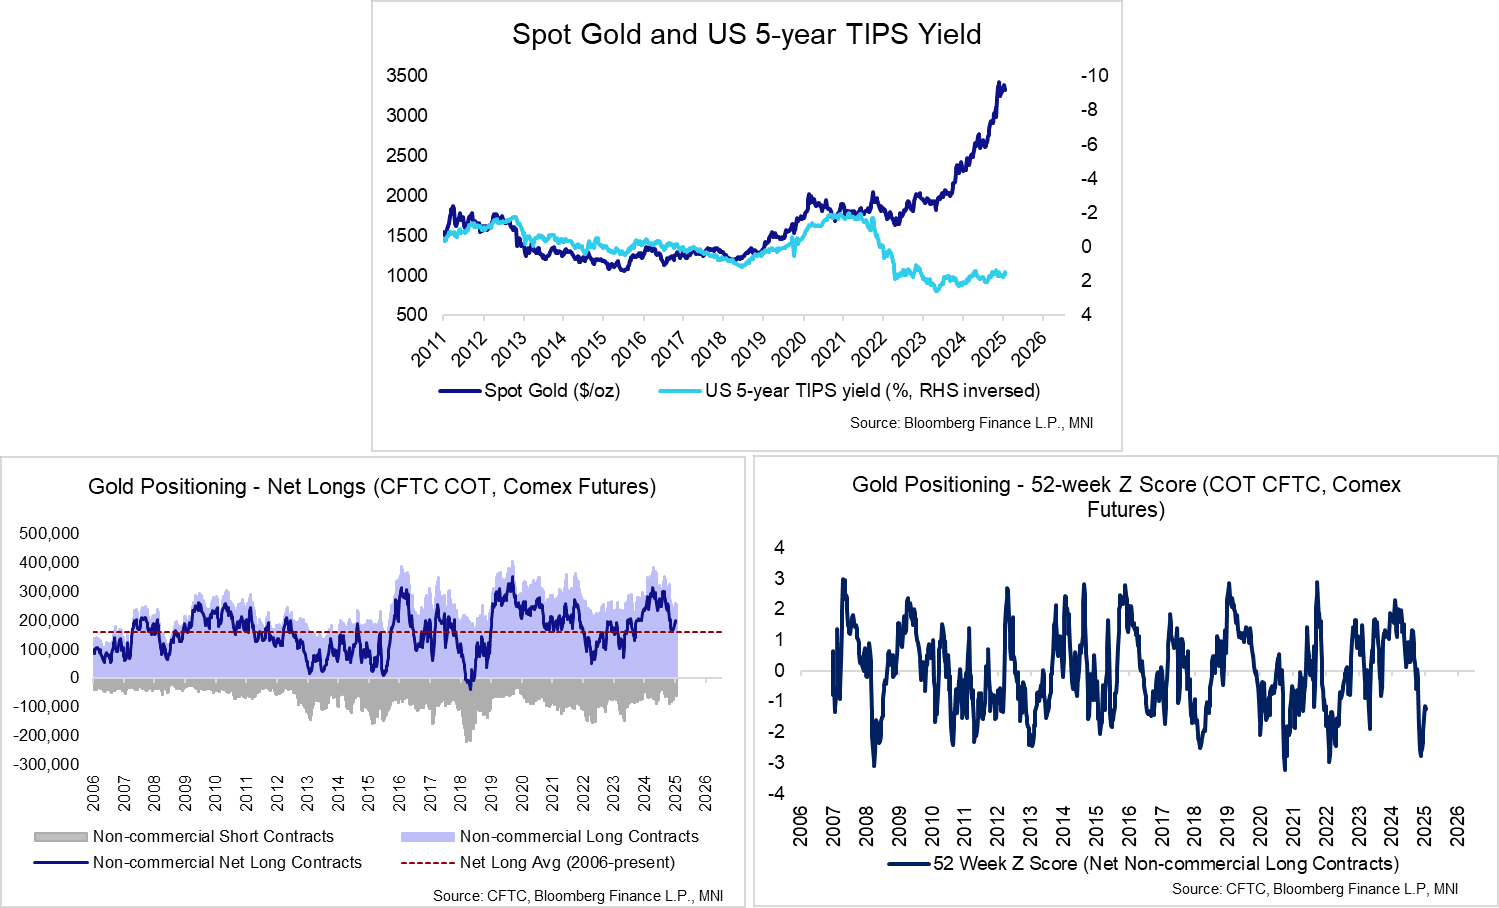
Spot gold has rallied around 3% from yesterday’s $3,248.7 low, currently at $3,347.2. The recovery highlights a possible false trendline break, after spot pushed through the 50-day EMA and trendline support drawn from the Dec 30 low last Friday. Gold has pierced initial resistance at $3,336.1 (20-day EMA), exposing the June 23 high at $3395.1.
- This week’s pullback in US real yields appears to have supported gold via two channels. First, weaker real yields (US 5-year TIPS is down 5bps from Friday’s close) makes non-interest-bearing gold relatively more attractive. Second, the dollar index is down 0.5% today, buoying dollar-denominated spot.
- Though the yield channel provides a reasonable explanation for this week’s price action in gold, it’s worth remembering that on a longer-term horizon, gold prices have diverged significantly from real yields since mid-2021.
- The latest positioning data only covers the week to June 24, so does not incorporate last week’s technical breaks. As of June 24, total non-commercial net longs were 195k, up from a low of 161k on May 13 and above the 162k long-term average.
COMMODITIES: Gold Back Above 50-Day EMA and a Trendline Support
- WTI futures maintain a softer tone following the reversal from the Jun 23 high. Support to watch is at the 50-day EMA, at $64.60. It has been pierced, a clear break of it would signal scope for a deeper retracement. This would expose $58.87, the May 30 low. On the upside, initial resistance to watch is $71.20, the 50.0% retracement of the Jun 23 - 24 high-low range. Key resistance is at $78.40, the Jun 23 high.
- Gold traded lower Friday resulting in a breach of the 50-day EMA, and a trendline drawn from the Dec 30 ‘24 low. A clear break of both support points would signal scope for a deeper correction - this would expose $3245.5, the May 29 low. The metal has recovered from yesterday’s low and for now, this highlights a possible false trendline break. Stronger gains would refocus attention $3451.3, Jun 16 high. The bear trigger is $3248.7, the Jun 30 low.
| Date | GMT/Local | Impact | Country | Event |
| 01/07/2025 | - | *** | Domestic-Made Vehicle Sales | |
| 01/07/2025 | 1255/0855 | ** | Redbook Retail Sales Index | |
| 01/07/2025 | 1330/1430 | BOE Bailey On Panel At Sintra Conference | ||
| 01/07/2025 | 1330/0930 | Fed Chair Jerome Powell | ||
| 01/07/2025 | 1330/1530 | ECB Lagarde On Sintra Panel | ||
| 01/07/2025 | 1345/0945 | *** | S&P Global Manufacturing Index (final) | |
| 01/07/2025 | 1400/1000 | *** | ISM Manufacturing Index | |
| 01/07/2025 | 1400/1000 | * | Construction Spending | |
| 01/07/2025 | 1400/1000 | *** | JOLTS jobs opening level | |
| 01/07/2025 | 1400/1000 | *** | JOLTS quits Rate | |
| 01/07/2025 | 1400/1000 | * | Construction Spending | |
| 01/07/2025 | 1430/1030 | ** | Dallas Fed Services Survey | |
| 02/07/2025 | 0130/1130 | * | Building Approvals | |
| 02/07/2025 | 0130/1130 | ** | Retail Trade | |
| 02/07/2025 | 0800/1000 | ECB de Guindos Chairs Sintra Panel | ||
| 02/07/2025 | 0900/1100 | ** | Unemployment | |
| 02/07/2025 | 0900/1000 | ** | Gilt Outright Auction Result | |
| 02/07/2025 | 0900/1100 | ECB Cipollone Chairs Sintra Panel | ||
| 02/07/2025 | 1030/1230 | ECB Lane Chairs Sintra Panel | ||
| 02/07/2025 | 1030/1130 | BOE Taylor On Panel At Sintra Conference | ||
| 02/07/2025 | 1100/0700 | ** | MBA Weekly Applications Index | |
| 02/07/2025 | 1215/0815 | *** | ADP Employment Report | |
| 02/07/2025 | 1415/1615 | ECB Lagarde Gives Closing Sintra Remarks | ||
| 02/07/2025 | 1430/1030 | ** | DOE Weekly Crude Oil Stocks |