MACRO ANALYSIS: MNI US Macro Weekly: Too Solid For Comfort (1/2)
We've just published our US Macro Weekly - Download Full Report Here
- The US economy now appears to be on more solid footing than it seemed a week ago. Versus 45bp in Fed rate reductions through the remainder of 2025 as of last Friday, futures markets now price 40bp. Half of that retracement came Thursday at 0830ET, when Q2 GDP data, initial jobless claims, durable goods orders, and goods trade data all pointed to stronger ongoing GDP growth than previously anticipated.
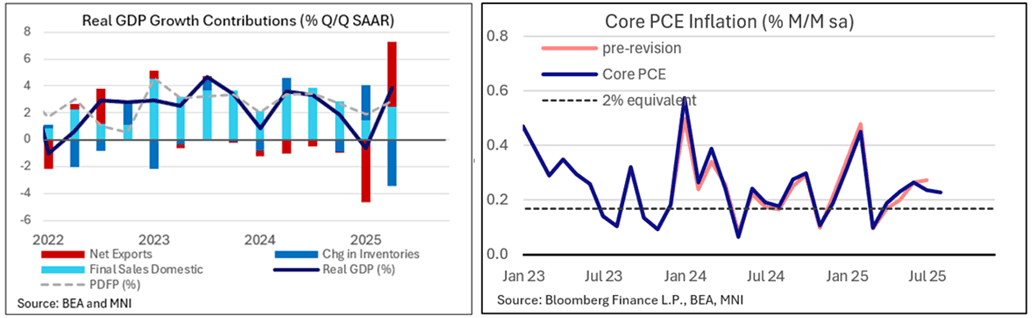
- Q2 GDP growth was revised up significantly in the 3rd and final reading, to 3.84% Q/Q SAAR from 3.29% in the 2nd reading (consensus had expected this to be unchanged in the 3rd).
- And while that’s in the past, the latest monthly data saw the Atlanta Fed's GDPNow estimate for Q3 jump to 3.9% from 3.3% last week.
- Friday’s PCE data suggested solid consumption dynamics through August (and no nasty surprises in the core inflation data).
- As such, the week’s data almost unambiguously portrayed a better domestic demand story through – and beyond – a volatile first half of the year related to tariff policy shifts.
- That poses something of a quandary for a Fed that has shifted its sights to labor market risks. GDP is not employment, but a case for rate cuts at a time when inflation is still pushing 3% is tougher to make when the economy is growing at close to a 4% real pace and equities remain at or near all-time highs.
- October's cut is no longer such a sure thing as it seemed after the September meeting, with a 25bp ease now priced at 21bp (~84% implied prob), versus closer to 23bp (90+%) at the end of the prior week.
Want to read more?
Find more articles and bullets on these widgets:
Historical bullets
US TSYS: US Tsys Tracked German Bund, French Oat Earlier, Extend Late Highs
- Tsys reversed early weakness - extended highs in 2s-10s - following German Bund and French Oat contracts. Sources posited real$ bought the early dip in OATS squeezing shorts with Bunds then Tsys reacting in short order on decent volumes.
- Dec'25 10Y contract tapped 112-15, just below technical resistance at 112-15+, the Aug 5 high and the bull trigger. Clearance of this hurdle would resume the uptrend and pave the way for a climb towards 112-19 initially, a Fibonacci projection.
- Tsy curves twist steeper: 2s10s +3.484 at 61.533 (nearing mid-April's 3Y highs), 5s30s +3.160 at 120.597.
- No reaction to MBA composite mortgage applications dip -0.5% (sa) last week after -1.4% the week prior as they still holds onto most of its refi-driven 11% increase before that. New purchase applications increased 2.2%, their largest increase in a month, whilst refi applications fell another -3.5% after -3.1% following the 23% jump before that.
- NY Fed President Williams (permanent FOMC voter) on CNBC doesn't sound particularly concerned about the state of the labor market, in particular downplaying the weak nonfarm payrolls growth implied by the July employment report's downward revisions.
- Uncertainty over an independent Federal Reserve aside (following Trump's "firing" of Fed Gov Cook late Monday) Trump seeking a majority of like minded Fed boardmen in the aftermath of Chairman Powell's dovish Jackson Hole speech appears to be emboldening risk takers as SPX emini and Nasdaq indexes made new highs (6502.50 and 21616.18 respectively)
- Look ahead to Thursday's session: Weekly Claims, GDP, PCE and US Tsy $44B 7Y Auction.
USDCAD TECHS: Bullish Trend Structure
- RES 4: 1.4111 High Apr 10
- RES 3: 1.4019 38.2% retracement of the Feb 3 - Jun 16 bear leg
- RES 2: 1.3968 High May 20
- RES 1: 1.3925 High Aug 22
- PRICE: 1.3826 @ 16:10 BST Aug 27
- SUP 1: 1.3807 20-day EMA
- SUP 2: 1.3777/22 50-day EMA / Low Aug 7
- SUP 3: 1.3576 Low Jul 23
- SUP 4: 1.3557/40 Low Jul 3 / Low Jun 16 and the bear trigger
A bull cycle in USDCAD that started mid-June remains in play, despite Wednesday’s fade into the close. The recent breach of resistance at 1.3879, the Aug 1 high, continues to highlight a bullish phase. Moving average studies have recently crossed and are in a bull-mode position, strengthening the current uptrend. An extension higher would signal scope for 1.4019, a Fibonacci retracement. Support to watch lies at 1.3775, the 50-day EMA. A break of the EMA would signal a reversal.
AUDUSD TECHS: Holding On To Its Latest Gains
- RES 4: 0.6688 High Nov 7 ‘24
- RES 3: 0.6677 0.764 proj of the Jun 23 - Jul 11 - 17 price swing
- RES 2: 0.6569/6625 High Aug 14 / 24 and the bull trigger
- RES 1: 0.6524 High Aug 18
- PRICE: 0.6487 @ 16:01 BST Aug 27
- SUP 1: 0.6415 Low Aug 21 / 22
- SUP 2: 0.6373 Low Jun 23
- SUP 3: 0.6354 38.2% retracement of the Apr 9 - Jul 24 upleg
- SUP 4: 0.6323 Low Apr 16
AUDUSD is holding on to its latest gains following the recovery from last week’s low. The rally signals the end of the recent corrective phase, backed up by Wednesday’s sharp bounce off the daily low. A continuation higher here would signal scope for a climb towards 0.6569, the Aug 14 high. Key resistance and the bull trigger is at 0.6625, the Aug 24 high. On the downside, support to watch lies at 0.6415, the Aug 21 / 22 low. A clear break of it would resume the bear leg.