MACRO ANALYSIS: MNI US Macro Weekly: Alternative Labor Data Mostly Disappoint
We've just published our US Macro Weekly - Download Full Report Here
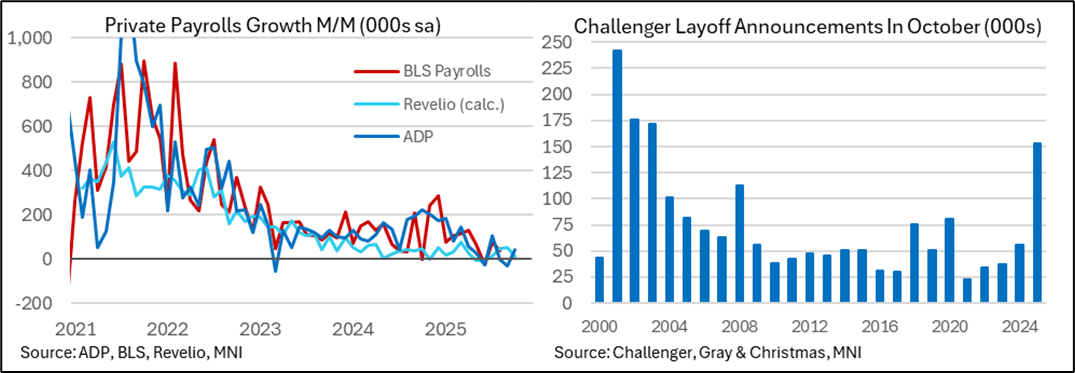
- Our mantra throughout the increasingly lengthy federal government data blackout has been: no "official" data, no problem. There’s been enough “alternative” data to get a sense of underlying economic currents even without the touchstone nonfarm payrolls and GDP releases, and overall they continue to suggest solid economic activity but a continued slow cooling in the labor market.
- ADP employment was firmer than expected for October and the NFIB jobs report showed little deterioration on the small business front, but most other labor releases have disappointed, most notably a negative Revelio labs nonfarm payrolls estimate and a spike in job cut announcements in the Challenger report.
- The ISM mfg survey for October underwhelmed across the board, undershooting regional Fed surveys, the MNI Chicago PMI and what continues to be a much more optimistic S&P Global PMI. New orders disappointed a bounce seen elsewhere and prices paid fell to the lowest since January.
- However, the ISM services report was the strongest overall since early in the year, with its headline index rising 2.4pts to 52.4 for an 8-month high. This easily exceeded the expectation and came with improvements in most of the key subcomponents, though employment remained weak and there were signs of continuing acute inflationary pressures.
- The preliminary U.Mich consumer survey for November saw a sharp decline in consumer sentiment as the perception of current conditions slid to their lowest on record. We continue to advise caution with these preliminary surveys as they can be more susceptible to a heavier weighting of certain political affiliation.
- Growth tracking looks solid on net though, with the Dallas Fed weekly growth indicator continuing to slow but from high levels whilst the Atlanta Fed’s GDPNow sees 4.0% annualized Q3 real GDP growth.
- US rates head towards the end of the week at their most dovish of the week, paring some of the hawkish shift after Powell drove uncertainty over a December rate cut at the Oct 29 FOMC press conference.
Want to read more?
Find more articles and bullets on these widgets:
Historical bullets
US FISCAL: FY2025 Deficit On Low Side, With Tariffs Offsetting Debt Servicing
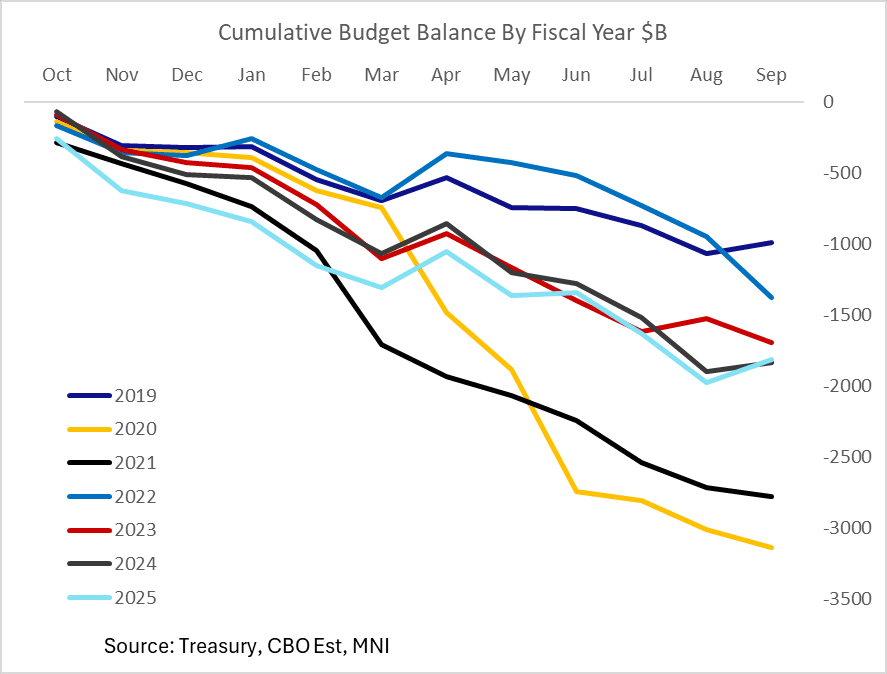
The Congressional Budget Office (CBO) estimates in its Monthly Budget Review that the federal government posted a fiscal surplus of $160B in September, vs a $345B deficit in August. That would be much more positive than the $55B expected by Bloomberg consensus, if confirmed by the Treasury's monthly report (technically due out Friday as the 8th business day of the year, but the first release of the new fiscal year usually comes out later).
- September was also the final month of the 2025 fiscal year, which would make the full-year deficit $1.809T - $8B smaller than the 2024 deficit of $1.817T. Even so, that flatters the 2024 outcome relative to 2025, due to timing shifts at the start of FY2024 without which the FY2025 deficit would have been $80B smaller than 2024's.
- For the year, outlays rose $301B (+4%) to $7.0T as "higher in several areas, including the largest benefit programs and net interest on the public debt (which, for the first time, surpassed $1 trillion)", with receipts up $308B (+6%) to $5.2T.
- We await the full Treasury report but the standouts are that corporate income taxes fell 15% Y/Y ($77B) with individual taxes up 6% Y/Y ($260B) and customs duties (including tariffs) up 153% ($118B to $195B). Net interest on the public debt rose $80B to $1.03T.
- This is a smaller deficit than CBO's projection in January 2025 ($1.9T) and "all told, revenues and outlays alike were slightly more than the totals projected in January."
- By our estimates it's possible the deficit will come in just below 6% of GDP, depending on growth in the Jul-Sep quarter, for the first time since FY2022 (FY2024's deficit was 6.4% of GDP).
- The CBO's regular 10-year outlook serves as a benchmark for broader expectations of the longer-term fiscal dynamics and will be eyed upon its expected release in January 2026.
USDCAD TECHS: Bullish Wave
- RES 4: 1.4111 High Apr 10
- RES 3: 1.4083 3.0% Upper Bollinger Band
- RES 2: 1.4019 38.2% retracement of the Feb 3 - Jun 16 bear leg
- RES 1: 1.3982 200-dma
- PRICE: 1.3954 @ 16:31 BST Oct 8
- SUP 1: 1.3889/3839 20- and 50-day EMA values
- SUP 2: 1.3727 Low Aug 29 and a bear trigger
- SUP 3: 1.3689 Low Jul 28
- SUP 4: 1.3637 Low Jul 25
USDCAD continues to trade just ahead of its recent highs. A bull cycle remains intact. The breach of 1.3959, the Sep 26 high, reinforces current conditions. The move higher maintains the bullish price sequence of higher highs and higher lows. Note too that moving average studies are in a bull-mode position, highlighting a dominant uptrend. Sights are on 1.4019, a Fibonacci retracement point. On the downside, first key support lies at 1.3834, the 50-day EMA.
AUDUSD TECHS: Monitoring Support
- RES 4: 0.6763 1.382 proj of the Jun 23 - Jul 24 - Aug 21 price swing
- RES 3: 0.6726 1.236 proj of the Jun 23 - Jul 24 - Aug 21 price swing
- RES 2: 0.6660/6707 High Sep 18 / 17 and key resistance
- RES 1: 0.6629 High Sep 30 & Oct 01
- PRICE: 0.6586 @ 16.30 BST Oct 8
- SUP 1: 0.6527/21 61.8% of the Aug 21 - Sep 17 bull leg / Low Sep 26
- SUP 2: 0.6484 76.4% retracement of the Aug 21 - Sep 17 bull leg
- SUP 3: 0.6463/6415 Low Aug 27 / Low Aug 21 / 22 and a bear trigger
- SUP 4: 0.6373 Low Jun 23
The AUDUSD uptrend remains intact and the latest pullback is considered corrective. The pair has again pierced support at the 50-day EMA, at 0.6563. A clear break of this average would signal scope for a deeper retracement and expose 0.6527 once again, a Fibonacci retracement. For bulls, a reversal higher would refocus attention on 0.6707, the Sep 17 high. Initial resistance to watch is 0.6629, the Sep 30 and Oct 1 high.